29
/
en
AIzaSyAYiBZKx7MnpbEhh9jyipgxe19OcubqV5w
April 1, 2024
269285
Turkey
TUR
true
2
1
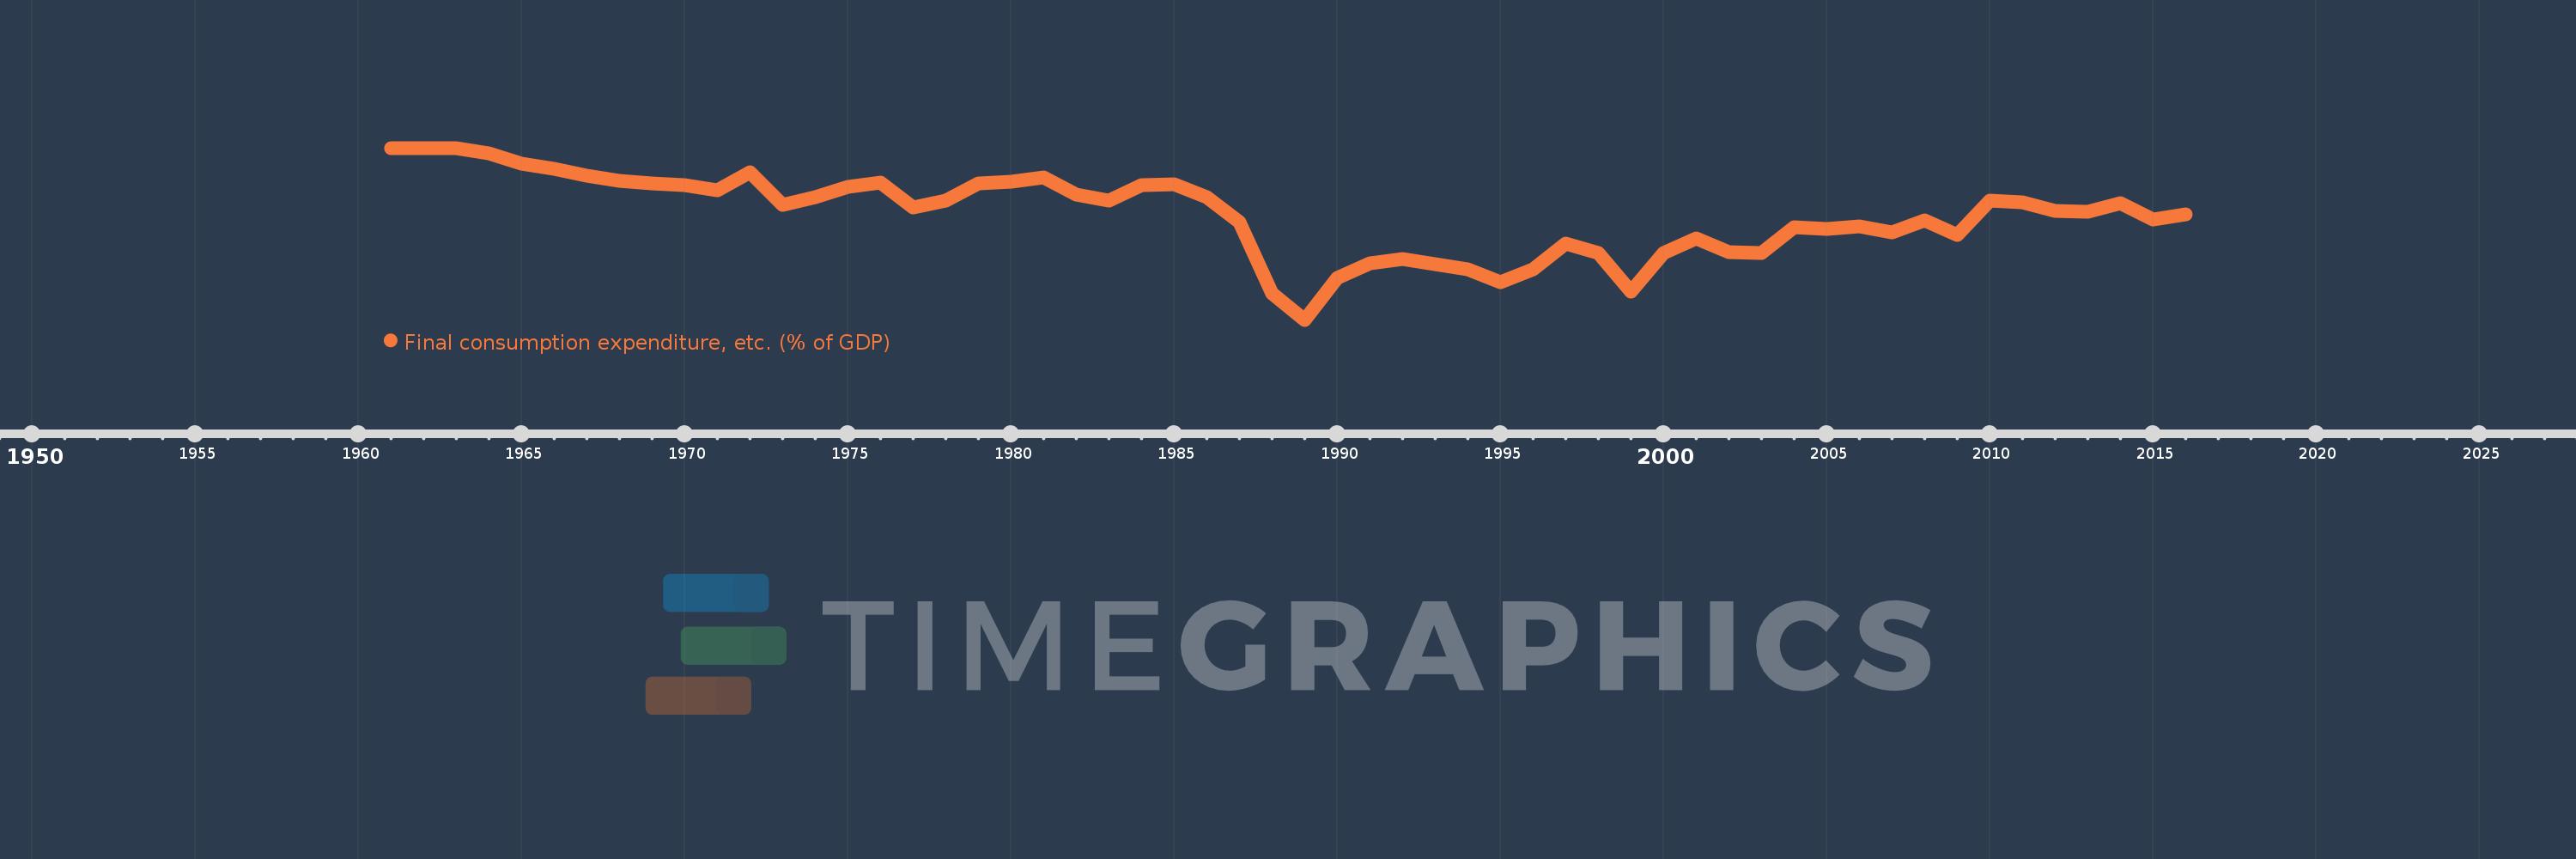
Final consumption expenditure, etc. (% of GDP)
2016,2015,2014,2013,2012,2011,2010,2009,2008,2007,2006,2005,2004,2003,2002,2001,2000,1999,1998,1997,1996,1995,1994,1993,1992,1991,1990,1989,1988,1987,1986,1985,1984,1983,1982,1981,1980,1979,1978,1977,1976,1975,1974,1973,1972,1971,1970,1969,1968,1967,1966,1965,1964,1963,1962,1961
This statistics in other country:
AfghanistanAlbaniaAlgeriaAngolaAntigua and BarbudaArgentinaArmeniaArubaAustraliaAustriaAzerbaijanBahamas, TheBahrainBangladeshBarbadosBelarusBelgiumBelizeBeninBermudaBhutanBoliviaBosnia and HerzegovinaBotswanaBrazilBrunei DarussalamBulgariaBurkina FasoBurundiCabo VerdeCambodiaCameroonCanadaCentral African RepublicChadChileChinaColombiaComorosCongo, Dem. Rep.Congo, Rep.Costa RicaCote d'IvoireCroatiaCubaCyprusCzech RepublicDenmarkDjiboutiDominicaDominican RepublicEcuadorEgypt, Arab Rep.El SalvadorEquatorial GuineaEritreaEstoniaEthiopiaFaroe IslandsFijiFinlandFranceGabonGambia, TheGeorgiaGermanyGhanaGreeceGrenadaGuatemalaGuineaGuinea-BissauGuyanaHaitiHondurasHong Kong SAR, ChinaHungaryIcelandIndiaIndonesiaIran, Islamic Rep.IraqIrelandIsraelItalyJamaicaJapanJordanKazakhstanKenyaKiribatiKorea, Rep.KosovoKuwaitKyrgyz RepublicLao PDRLatviaLebanonLesothoLiberiaLibyaLithuaniaLuxembourgMacao SAR, ChinaMacedonia, FYRMadagascarMalawiMalaysiaMaldivesMaliMaltaMauritaniaMauritiusMexicoMicronesia, Fed. Sts.MoldovaMongoliaMontenegroMoroccoMozambiqueNamibiaNepalNetherlandsNew CaledoniaNew ZealandNicaraguaNigerNigeriaNorwayOmanPakistanPanamaPapua New GuineaParaguayPeruPhilippinesPolandPortugalPuerto RicoQatarRomaniaRussian FederationRwandaSaudi ArabiaSenegalSerbiaSeychellesSierra LeoneSingaporeSlovak RepublicSloveniaSolomon IslandsSomaliaSouth AfricaSouth SudanSpainSri LankaSt. Kitts and NevisSt. LuciaSt. Vincent and the GrenadinesSudanSurinameSwazilandSwedenSwitzerlandSyrian Arab RepublicTajikistanTanzaniaThailandTimor-LesteTogoTongaTrinidad and TobagoTunisiaTurkeyTurkmenistanUgandaUkraineUnited Arab EmiratesUnited KingdomUnited StatesUruguayUzbekistanVanuatuVenezuela, RBVietnamWest Bank and GazaYemen, Rep.ZambiaZimbabwe Timeline:
This timeline shows a graph from 1961 to 2016 of Turkey. No data until 1960. Number of actual observations by date: 56.
Source name:
World Development Indicators
Source organization:
World Bank national accounts data, and OECD National Accounts data files.
Categories, topics:
Economy & Growth
Last updated:
apr 23, 2017
Indicators value changes by year
Minimum:
73.756
jan 1, 1989
At the date of observation
Value
Absolute change
Change from previous value
jan 1, 1961
91.63
+91.63
0.0%
jan 1, 1962
91.69
+0.06
0.07%
jan 1, 1963
91.656
-0.033
-0.04%
jan 1, 1964
91.094
-0.562
-0.61%
jan 1, 1965
90.06
-1.035
-1.14%
jan 1, 1966
89.488
-0.571
-0.63%
jan 1, 1967
88.749
-0.739
-0.83%
jan 1, 1968
88.227
-0.522
-0.59%
jan 1, 1969
88.0
-0.227
-0.26%
jan 1, 1970
87.785
-0.215
-0.24%
jan 1, 1971
87.226
-0.559
-0.64%
jan 1, 1972
89.155
+1.928
2.21%
jan 1, 1973
85.714
-3.44
-3.86%
jan 1, 1974
86.593
+0.879
1.03%
jan 1, 1975
87.656
+1.063
1.23%
jan 1, 1976
88.101
+0.445
0.51%
jan 1, 1977
85.483
-2.618
-2.97%
jan 1, 1978
86.226
+0.742
0.87%
jan 1, 1979
87.995
+1.77
2.05%
jan 1, 1980
88.161
+0.166
0.19%
jan 1, 1981
88.602
+0.441
0.5%
jan 1, 1982
86.798
-1.804
-2.04%
jan 1, 1983
86.2
-0.598
-0.69%
jan 1, 1984
87.799
+1.599
1.86%
jan 1, 1985
87.887
+0.087
0.1%
jan 1, 1986
86.592
-1.294
-1.47%
jan 1, 1987
83.942
-2.65
-3.06%
jan 1, 1988
76.51
-7.432
-8.85%
jan 1, 1989
73.756
-2.754
-3.6%
jan 1, 1990
78.105
+4.349
5.9%
jan 1, 1991
79.664
+1.558
2.0%
jan 1, 1992
80.082
+0.418
0.52%
jan 1, 1993
79.591
-0.491
-0.61%
jan 1, 1994
79.054
-0.537
-0.67%
jan 1, 1995
77.701
-1.353
-1.71%
jan 1, 1996
78.986
+1.285
1.65%
jan 1, 1997
81.733
+2.747
3.48%
jan 1, 1998
80.696
-1.037
-1.27%
jan 1, 1999
76.729
-3.967
-4.92%
jan 1, 2000
80.722
+3.993
5.2%
jan 1, 2001
82.23
+1.507
1.87%
jan 1, 2002
80.79
-1.439
-1.75%
jan 1, 2003
80.751
-0.039
-0.05%
jan 1, 2004
83.447
+2.695
3.34%
jan 1, 2005
83.244
-0.203
-0.24%
jan 1, 2006
83.507
+0.263
0.32%
jan 1, 2007
82.856
-0.65
-0.78%
jan 1, 2008
84.093
+1.237
1.49%
jan 1, 2009
82.651
-1.442
-1.71%
jan 1, 2010
86.168
+3.517
4.25%
jan 1, 2011
86.027
-0.14
-0.16%
jan 1, 2012
85.115
-0.913
-1.06%
jan 1, 2013
85.03
-0.085
-0.1%
jan 1, 2014
85.901
+0.87
1.02%
jan 1, 2015
84.232
-1.668
-1.94%
jan 1, 2016
84.772
+0.54
0.64%
Ranking of countries by current statistics by years


Comments: