29
/
en
AIzaSyAYiBZKx7MnpbEhh9jyipgxe19OcubqV5w
April 1, 2024
160445
Israel
ISR
true
2
1
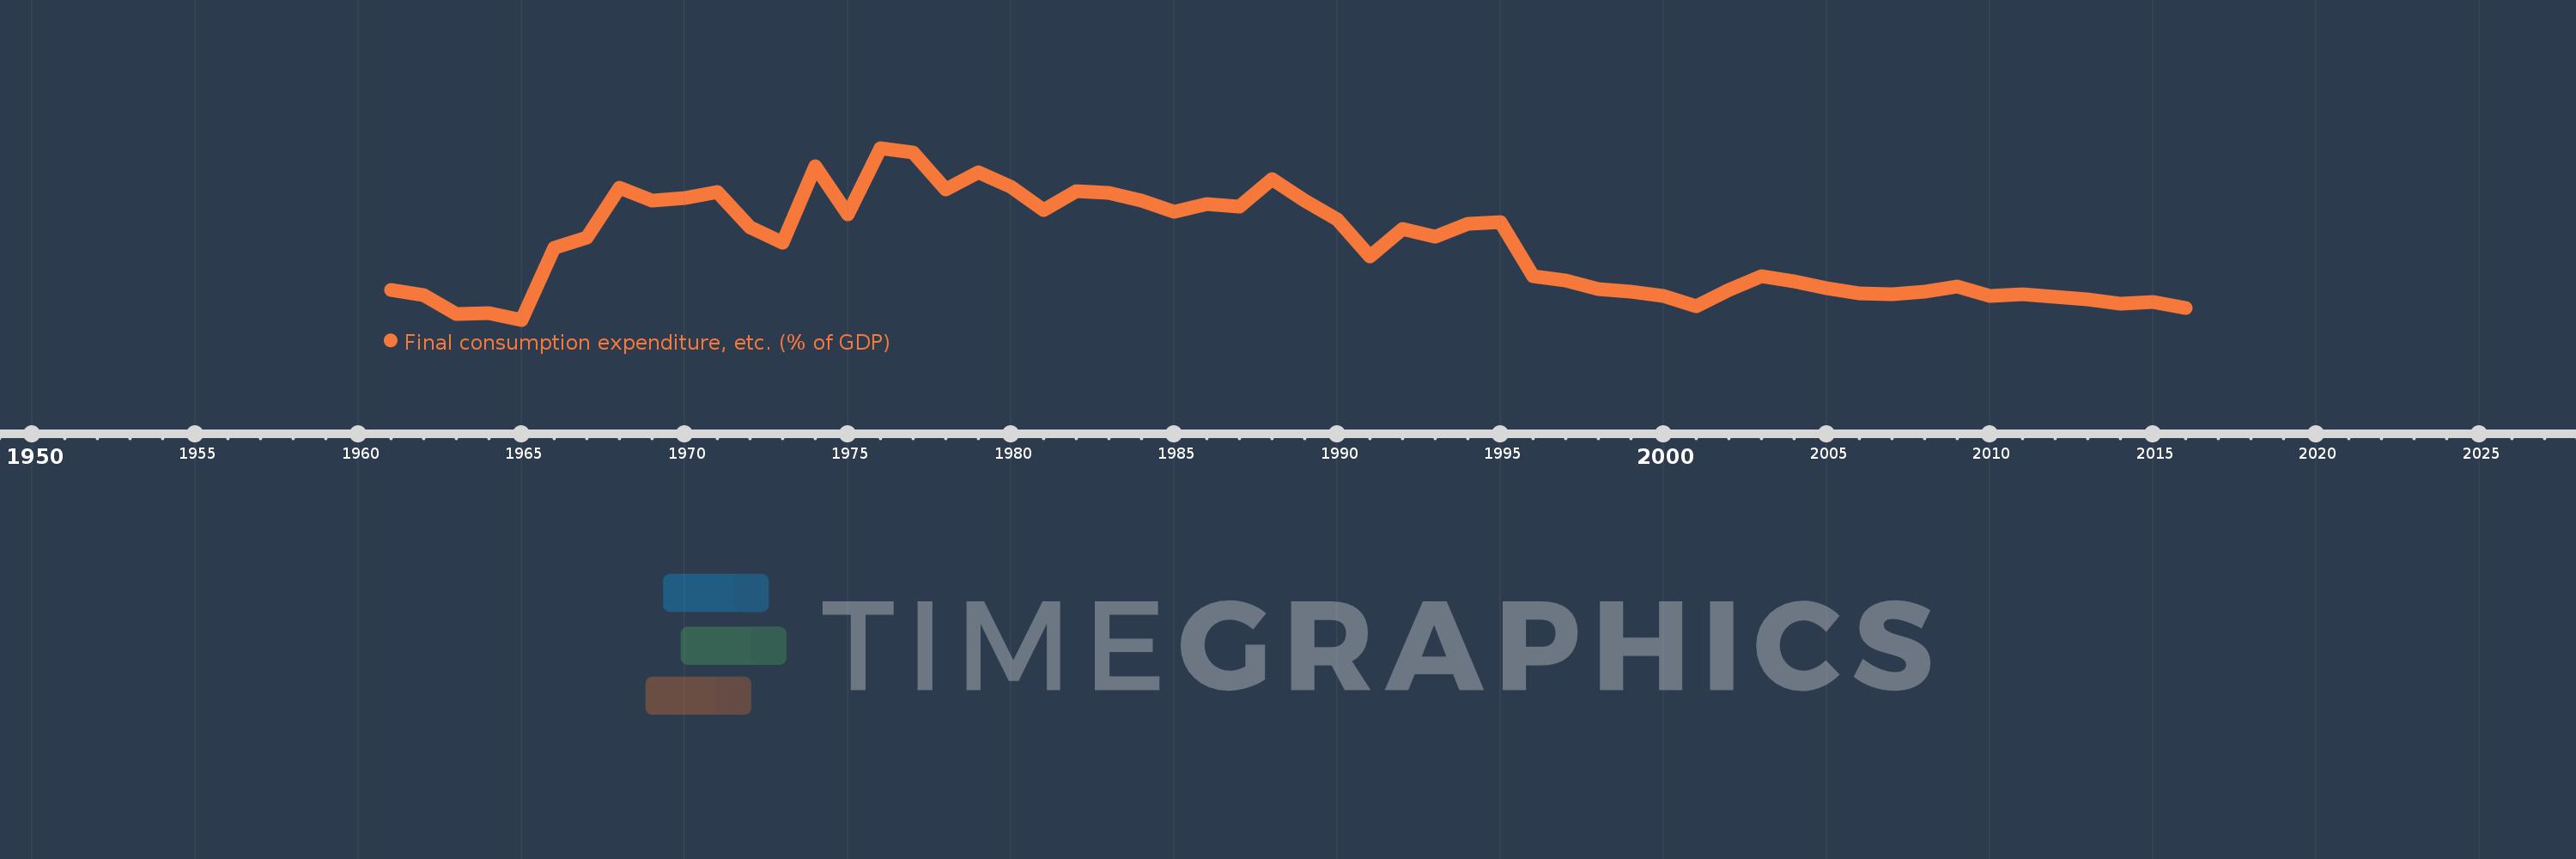
Final consumption expenditure, etc. (% of GDP)
2016,2015,2014,2013,2012,2011,2010,2009,2008,2007,2006,2005,2004,2003,2002,2001,2000,1999,1998,1997,1996,1995,1994,1993,1992,1991,1990,1989,1988,1987,1986,1985,1984,1983,1982,1981,1980,1979,1978,1977,1976,1975,1974,1973,1972,1971,1970,1969,1968,1967,1966,1965,1964,1963,1962,1961
This statistics in other country:
AfghanistanAlbaniaAlgeriaAngolaAntigua and BarbudaArgentinaArmeniaArubaAustraliaAustriaAzerbaijanBahamas, TheBahrainBangladeshBarbadosBelarusBelgiumBelizeBeninBermudaBhutanBoliviaBosnia and HerzegovinaBotswanaBrazilBrunei DarussalamBulgariaBurkina FasoBurundiCabo VerdeCambodiaCameroonCanadaCentral African RepublicChadChileChinaColombiaComorosCongo, Dem. Rep.Congo, Rep.Costa RicaCote d'IvoireCroatiaCubaCyprusCzech RepublicDenmarkDjiboutiDominicaDominican RepublicEcuadorEgypt, Arab Rep.El SalvadorEquatorial GuineaEritreaEstoniaEthiopiaFaroe IslandsFijiFinlandFranceGabonGambia, TheGeorgiaGermanyGhanaGreeceGrenadaGuatemalaGuineaGuinea-BissauGuyanaHaitiHondurasHong Kong SAR, ChinaHungaryIcelandIndiaIndonesiaIran, Islamic Rep.IraqIrelandIsraelItalyJamaicaJapanJordanKazakhstanKenyaKiribatiKorea, Rep.KosovoKuwaitKyrgyz RepublicLao PDRLatviaLebanonLesothoLiberiaLibyaLithuaniaLuxembourgMacao SAR, ChinaMacedonia, FYRMadagascarMalawiMalaysiaMaldivesMaliMaltaMauritaniaMauritiusMexicoMicronesia, Fed. Sts.MoldovaMongoliaMontenegroMoroccoMozambiqueNamibiaNepalNetherlandsNew CaledoniaNew ZealandNicaraguaNigerNigeriaNorwayOmanPakistanPanamaPapua New GuineaParaguayPeruPhilippinesPolandPortugalPuerto RicoQatarRomaniaRussian FederationRwandaSaudi ArabiaSenegalSerbiaSeychellesSierra LeoneSingaporeSlovak RepublicSloveniaSolomon IslandsSomaliaSouth AfricaSouth SudanSpainSri LankaSt. Kitts and NevisSt. LuciaSt. Vincent and the GrenadinesSudanSurinameSwazilandSwedenSwitzerlandSyrian Arab RepublicTajikistanTanzaniaThailandTimor-LesteTogoTongaTrinidad and TobagoTunisiaTurkeyTurkmenistanUgandaUkraineUnited Arab EmiratesUnited KingdomUnited StatesUruguayUzbekistanVanuatuVenezuela, RBVietnamWest Bank and GazaYemen, Rep.ZambiaZimbabwe Timeline:
This timeline shows a graph from 1961 to 2016 of Israel. No data until 1960. Number of actual observations by date: 56.
Source name:
World Development Indicators
Source organization:
World Bank national accounts data, and OECD National Accounts data files.
Categories, topics:
Economy & Growth
Last updated:
apr 23, 2017
Indicators value changes by year
Minimum:
75.137
jan 1, 1965
Maximum:
103.416
jan 1, 1976
At the date of observation
Value
Absolute change
Change from previous value
jan 1, 1961
80.104
+80.104
0.0%
jan 1, 1962
79.21
-0.894
-1.12%
jan 1, 1963
76.122
-3.088
-3.9%
jan 1, 1964
76.295
+0.173
0.23%
jan 1, 1965
75.137
-1.158
-1.52%
jan 1, 1966
87.015
+11.878
15.81%
jan 1, 1967
88.652
+1.636
1.88%
jan 1, 1968
96.873
+8.222
9.27%
jan 1, 1969
94.782
-2.091
-2.16%
jan 1, 1970
95.14
+0.358
0.38%
jan 1, 1971
96.112
+0.972
1.02%
jan 1, 1972
90.426
-5.686
-5.92%
jan 1, 1973
87.811
-2.615
-2.89%
jan 1, 1974
100.431
+12.62
14.37%
jan 1, 1975
92.505
-7.926
-7.89%
jan 1, 1976
103.416
+10.911
11.79%
jan 1, 1977
102.7
-0.715
-0.69%
jan 1, 1978
96.567
-6.133
-5.97%
jan 1, 1979
99.381
+2.814
2.91%
jan 1, 1980
96.972
-2.409
-2.42%
jan 1, 1981
93.158
-3.815
-3.93%
jan 1, 1982
96.345
+3.188
3.42%
jan 1, 1983
96.06
-0.285
-0.3%
jan 1, 1984
94.689
-1.372
-1.43%
jan 1, 1985
92.863
-1.826
-1.93%
jan 1, 1986
94.25
+1.388
1.49%
jan 1, 1987
93.777
-0.473
-0.5%
jan 1, 1988
98.291
+4.514
4.81%
jan 1, 1989
94.692
-3.598
-3.66%
jan 1, 1990
91.583
-3.109
-3.28%
jan 1, 1991
85.595
-5.988
-6.54%
jan 1, 1992
90.096
+4.501
5.26%
jan 1, 1993
88.846
-1.25
-1.39%
jan 1, 1994
90.935
+2.09
2.35%
jan 1, 1995
91.227
+0.292
0.32%
jan 1, 1996
82.261
-8.966
-9.83%
jan 1, 1997
81.643
-0.619
-0.75%
jan 1, 1998
80.119
-1.524
-1.87%
jan 1, 1999
79.747
-0.372
-0.46%
jan 1, 2000
79.073
-0.675
-0.85%
jan 1, 2001
77.4
-1.673
-2.12%
jan 1, 2002
80.057
+2.657
3.43%
jan 1, 2003
82.306
+2.249
2.81%
jan 1, 2004
81.391
-0.915
-1.11%
jan 1, 2005
80.29
-1.101
-1.35%
jan 1, 2006
79.508
-0.782
-0.97%
jan 1, 2007
79.314
-0.193
-0.24%
jan 1, 2008
79.776
+0.461
0.58%
jan 1, 2009
80.657
+0.881
1.1%
jan 1, 2010
79.112
-1.545
-1.92%
jan 1, 2011
79.291
+0.179
0.23%
jan 1, 2012
78.979
-0.312
-0.39%
jan 1, 2013
78.459
-0.521
-0.66%
jan 1, 2014
77.768
-0.69
-0.88%
jan 1, 2015
78.04
+0.272
0.35%
jan 1, 2016
77.034
-1.006
-1.29%
Ranking of countries by current statistics by years


Comments: