29
/
en
AIzaSyAYiBZKx7MnpbEhh9jyipgxe19OcubqV5w
April 1, 2024
73875
Austria
AUT
true
2
1
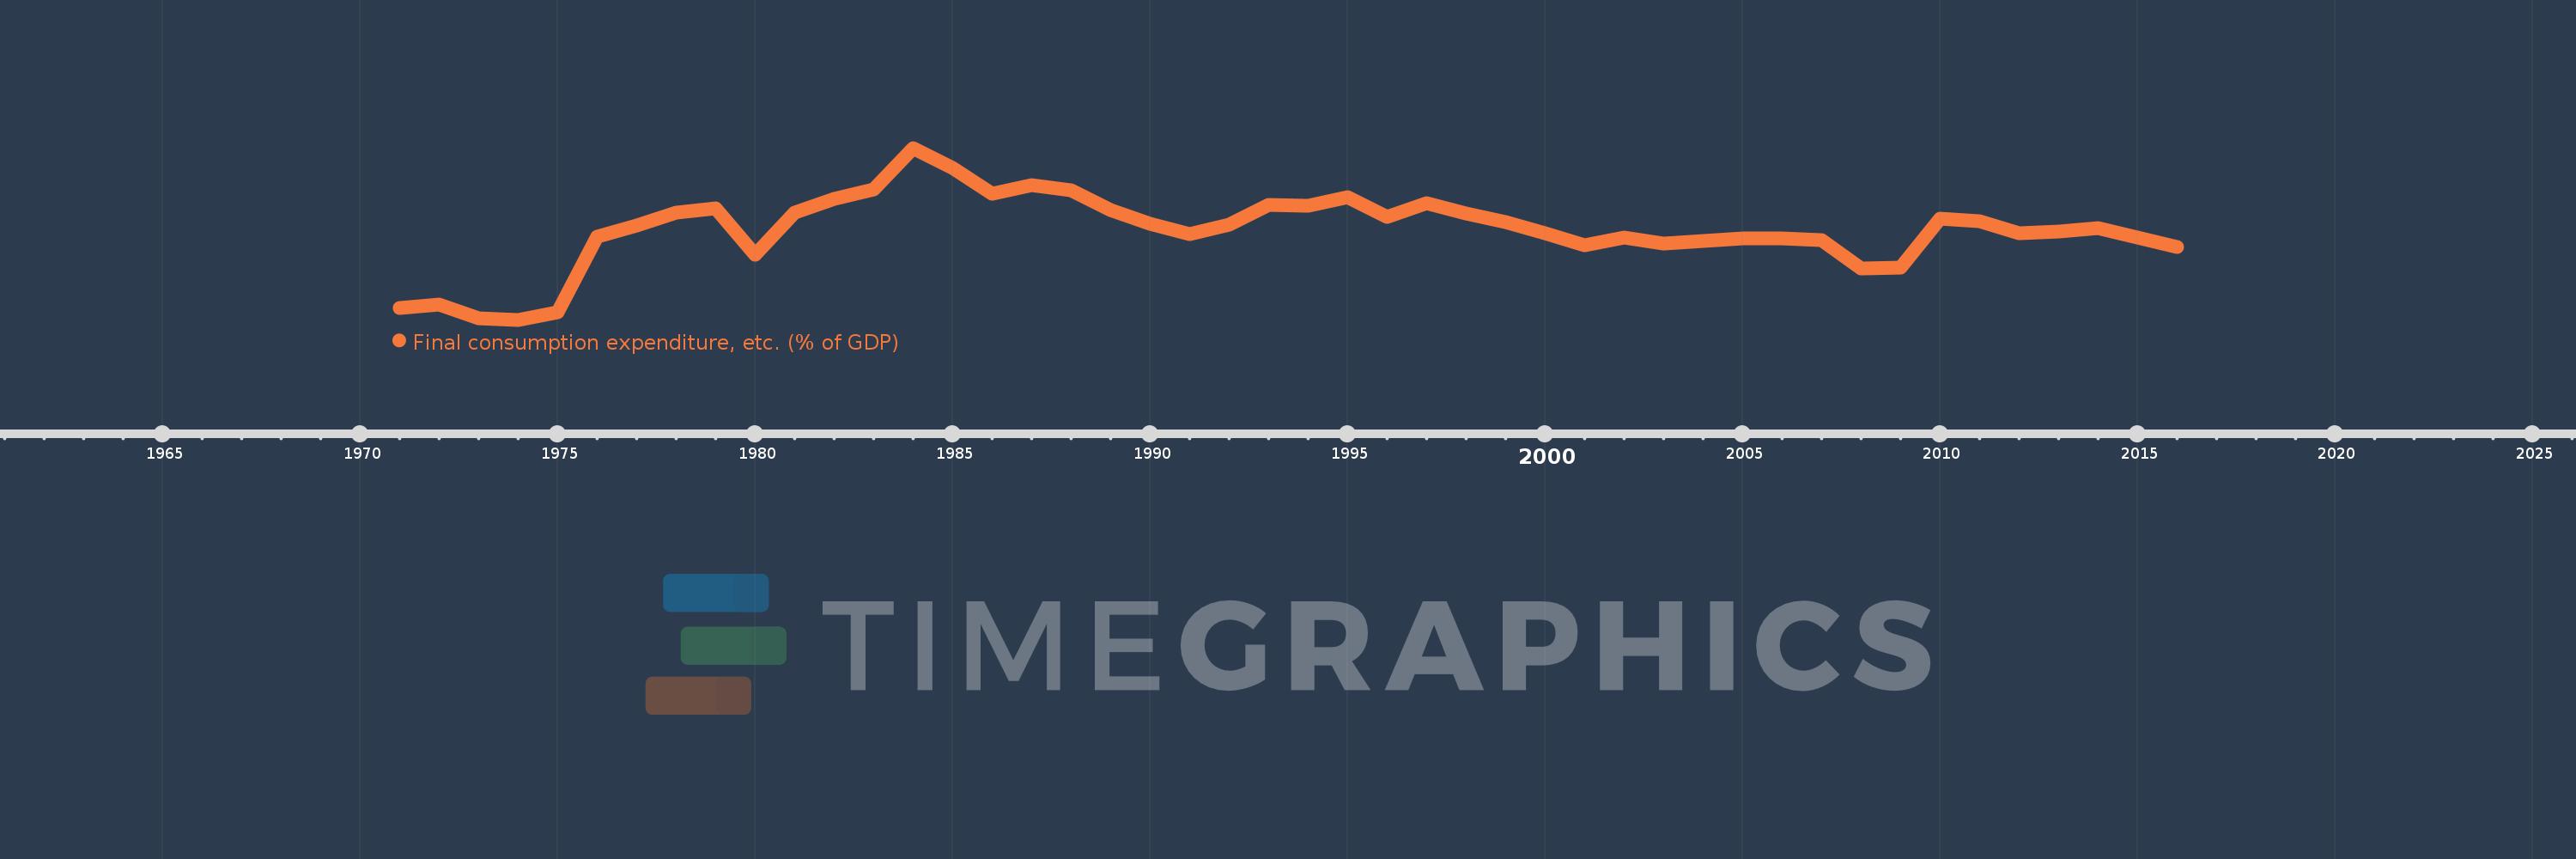
Final consumption expenditure, etc. (% of GDP)
2016,2015,2014,2013,2012,2011,2010,2009,2008,2007,2006,2005,2004,2003,2002,2001,2000,1999,1998,1997,1996,1995,1994,1993,1992,1991,1990,1989,1988,1987,1986,1985,1984,1983,1982,1981,1980,1979,1978,1977,1976,1975,1974,1973,1972,1971
This statistics in other country:
AfghanistanAlbaniaAlgeriaAngolaAntigua and BarbudaArgentinaArmeniaArubaAustraliaAustriaAzerbaijanBahamas, TheBahrainBangladeshBarbadosBelarusBelgiumBelizeBeninBermudaBhutanBoliviaBosnia and HerzegovinaBotswanaBrazilBrunei DarussalamBulgariaBurkina FasoBurundiCabo VerdeCambodiaCameroonCanadaCentral African RepublicChadChileChinaColombiaComorosCongo, Dem. Rep.Congo, Rep.Costa RicaCote d'IvoireCroatiaCubaCyprusCzech RepublicDenmarkDjiboutiDominicaDominican RepublicEcuadorEgypt, Arab Rep.El SalvadorEquatorial GuineaEritreaEstoniaEthiopiaFaroe IslandsFijiFinlandFranceGabonGambia, TheGeorgiaGermanyGhanaGreeceGrenadaGuatemalaGuineaGuinea-BissauGuyanaHaitiHondurasHong Kong SAR, ChinaHungaryIcelandIndiaIndonesiaIran, Islamic Rep.IraqIrelandIsraelItalyJamaicaJapanJordanKazakhstanKenyaKiribatiKorea, Rep.KosovoKuwaitKyrgyz RepublicLao PDRLatviaLebanonLesothoLiberiaLibyaLithuaniaLuxembourgMacao SAR, ChinaMacedonia, FYRMadagascarMalawiMalaysiaMaldivesMaliMaltaMauritaniaMauritiusMexicoMicronesia, Fed. Sts.MoldovaMongoliaMontenegroMoroccoMozambiqueNamibiaNepalNetherlandsNew CaledoniaNew ZealandNicaraguaNigerNigeriaNorwayOmanPakistanPanamaPapua New GuineaParaguayPeruPhilippinesPolandPortugalPuerto RicoQatarRomaniaRussian FederationRwandaSaudi ArabiaSenegalSerbiaSeychellesSierra LeoneSingaporeSlovak RepublicSloveniaSolomon IslandsSomaliaSouth AfricaSouth SudanSpainSri LankaSt. Kitts and NevisSt. LuciaSt. Vincent and the GrenadinesSudanSurinameSwazilandSwedenSwitzerlandSyrian Arab RepublicTajikistanTanzaniaThailandTimor-LesteTogoTongaTrinidad and TobagoTunisiaTurkeyTurkmenistanUgandaUkraineUnited Arab EmiratesUnited KingdomUnited StatesUruguayUzbekistanVanuatuVenezuela, RBVietnamWest Bank and GazaYemen, Rep.ZambiaZimbabwe Timeline:
This timeline shows a graph from 1971 to 2016 of Austria. No data until 1970. Number of actual observations by date: 46.
Source name:
World Development Indicators
Source organization:
World Bank national accounts data, and OECD National Accounts data files.
Categories, topics:
Economy & Growth
Last updated:
apr 23, 2017
Indicators value changes by year
Minimum:
68.188
jan 1, 1974
Maximum:
78.333
jan 1, 1984
At the date of observation
Value
Absolute change
Change from previous value
jan 1, 1971
68.858
+68.858
0.0%
jan 1, 1972
69.098
+0.24
0.35%
jan 1, 1973
68.252
-0.847
-1.23%
jan 1, 1974
68.188
-0.063
-0.09%
jan 1, 1975
68.627
+0.439
0.64%
jan 1, 1976
73.09
+4.463
6.5%
jan 1, 1977
73.734
+0.644
0.88%
jan 1, 1978
74.501
+0.767
1.04%
jan 1, 1979
74.753
+0.252
0.34%
jan 1, 1980
72.038
-2.715
-3.63%
jan 1, 1981
74.49
+2.452
3.4%
jan 1, 1982
75.308
+0.817
1.1%
jan 1, 1983
75.903
+0.595
0.79%
jan 1, 1984
78.333
+2.43
3.2%
jan 1, 1985
77.151
-1.182
-1.51%
jan 1, 1986
75.638
-1.513
-1.96%
jan 1, 1987
76.138
+0.5
0.66%
jan 1, 1988
75.835
-0.303
-0.4%
jan 1, 1989
74.659
-1.176
-1.55%
jan 1, 1990
73.874
-0.785
-1.05%
jan 1, 1991
73.239
-0.636
-0.86%
jan 1, 1992
73.805
+0.567
0.77%
jan 1, 1993
74.958
+1.152
1.56%
jan 1, 1994
74.937
-0.021
-0.03%
jan 1, 1995
75.431
+0.494
0.66%
jan 1, 1996
74.265
-1.166
-1.55%
jan 1, 1997
75.073
+0.809
1.09%
jan 1, 1998
74.451
-0.623
-0.83%
jan 1, 1999
73.958
-0.493
-0.66%
jan 1, 2000
73.296
-0.662
-0.89%
jan 1, 2001
72.605
-0.691
-0.94%
jan 1, 2002
73.047
+0.442
0.61%
jan 1, 2003
72.674
-0.373
-0.51%
jan 1, 2004
72.859
+0.185
0.25%
jan 1, 2005
72.99
+0.131
0.18%
jan 1, 2006
73.015
+0.024
0.03%
jan 1, 2007
72.897
-0.118
-0.16%
jan 1, 2008
71.228
-1.668
-2.29%
jan 1, 2009
71.28
+0.051
0.07%
jan 1, 2010
74.171
+2.891
4.06%
jan 1, 2011
74.022
-0.149
-0.2%
jan 1, 2012
73.305
-0.717
-0.97%
jan 1, 2013
73.387
+0.082
0.11%
jan 1, 2014
73.583
+0.197
0.27%
jan 1, 2015
73.044
-0.539
-0.73%
jan 1, 2016
72.485
-0.559
-0.77%
Ranking of countries by current statistics by years


Comments: