29
/
en
AIzaSyAYiBZKx7MnpbEhh9jyipgxe19OcubqV5w
April 1, 2024
94595
Burkina Faso
BFA
true
2
1
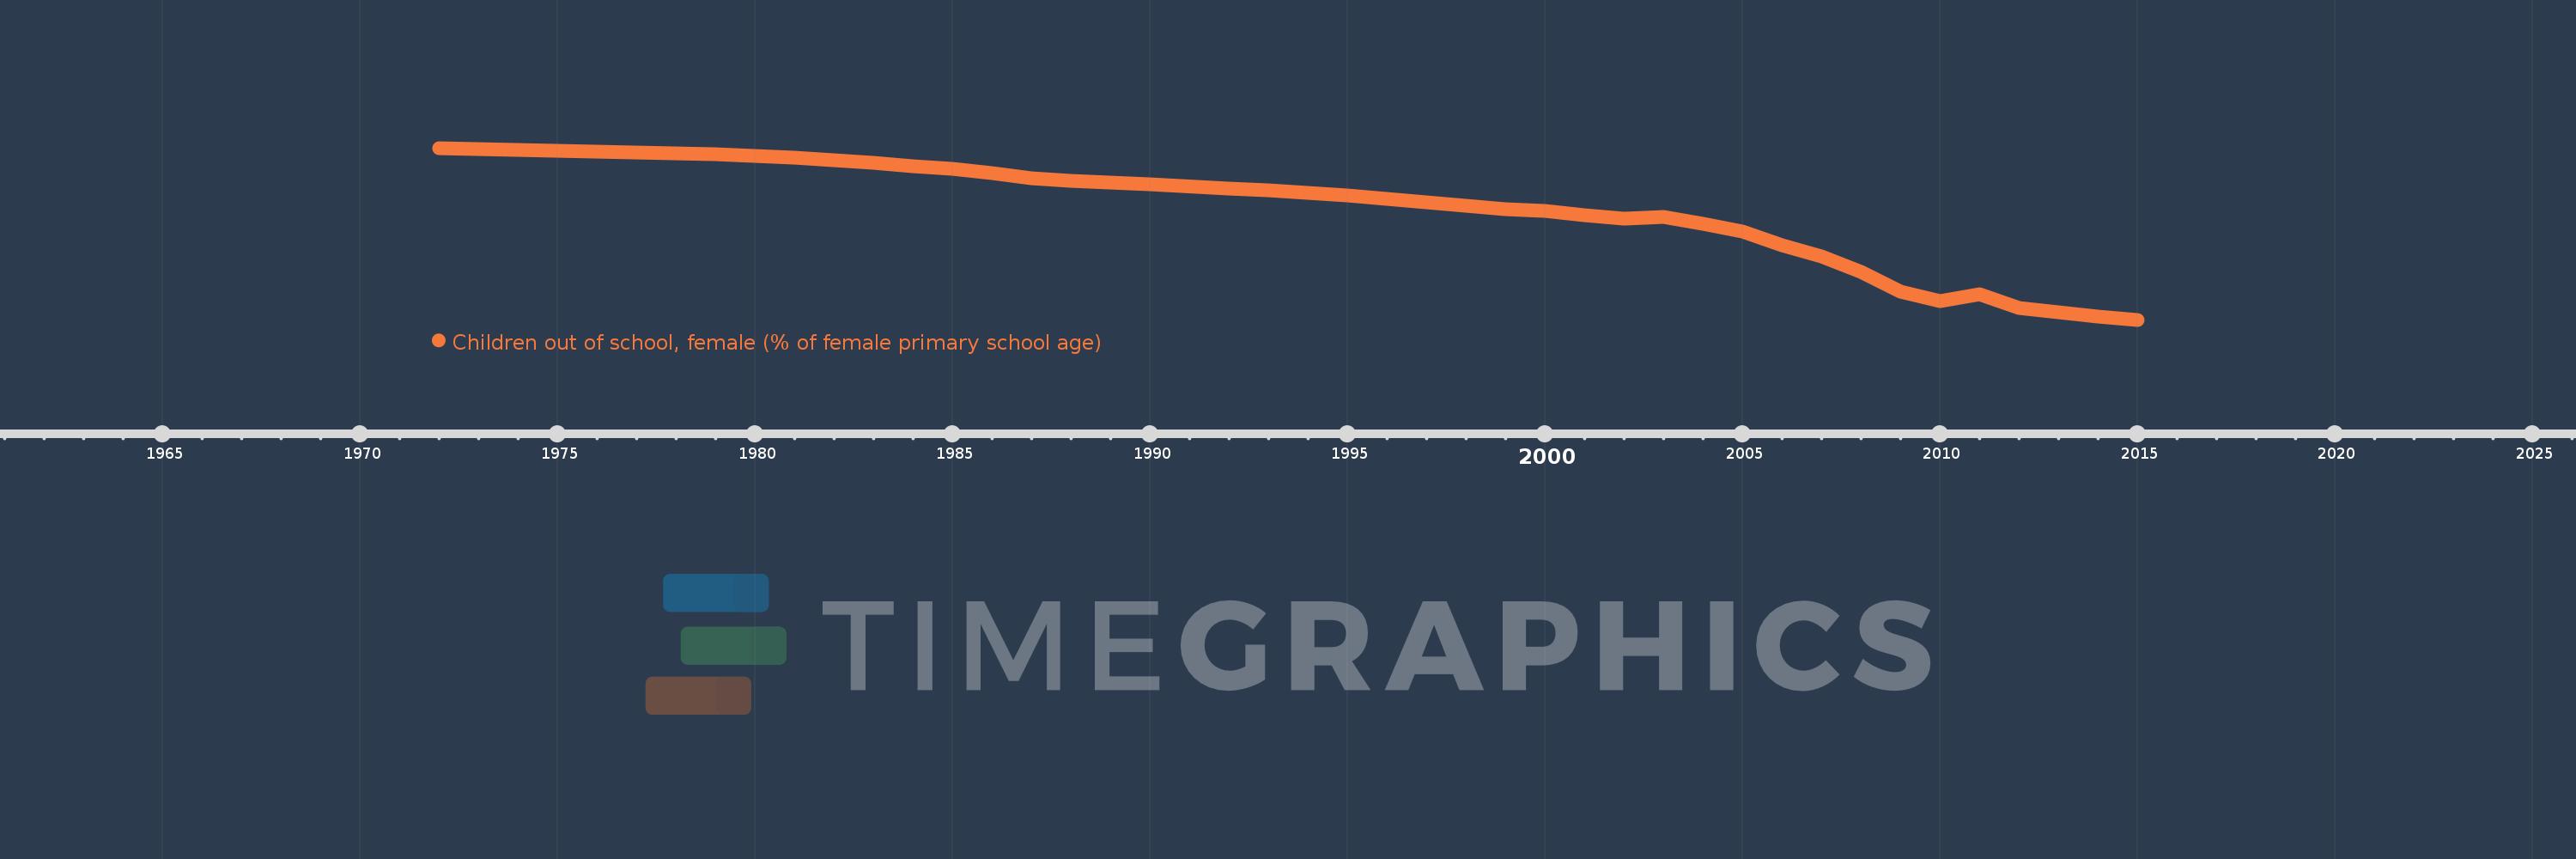
Children out of school, female (% of female primary school age)
2015,2014,2013,2012,2011,2010,2009,2008,2007,2006,2005,2004,2003,2002,2001,2000,1999,1996,1995,1994,1993,1992,1990,1989,1988,1987,1986,1985,1984,1983,1982,1981,1980,1979,1978,1973,1972
This statistics in other country:
AfghanistanAlbaniaAlgeriaAngolaAntigua and BarbudaArab WorldArgentinaArmeniaArubaAustraliaAustriaAzerbaijanBahamas, TheBahrainBangladeshBarbadosBelarusBelgiumBelizeBeninBermudaBhutanBoliviaBosnia and HerzegovinaBotswanaBrazilBrunei DarussalamBulgariaBurkina FasoBurundiCabo VerdeCambodiaCameroonCanadaCaribbean small statesCentral African RepublicCentral Europe and the BalticsChadChileChinaColombiaComorosCongo, Dem. Rep.Congo, Rep.Costa RicaCote d'IvoireCroatiaCubaCyprusDenmarkDjiboutiDominicaDominican RepublicEarly-demographic dividendEast Asia & PacificEast Asia & Pacific (excluding high income)East Asia & Pacific (IDA & IBRD countries)EcuadorEgypt, Arab Rep.El SalvadorEquatorial GuineaEritreaEstoniaEthiopiaEuro areaEurope & Central AsiaEurope & Central Asia (excluding high income)Europe & Central Asia (IDA & IBRD countries)European UnionFijiFinlandFragile and conflict affected situationsFranceGabonGambia, TheGeorgiaGhanaGreeceGrenadaGuatemalaGuineaGuinea-BissauGuyanaHaitiHeavily indebted poor countries (HIPC)High incomeHondurasHong Kong SAR, ChinaHungaryIBRD onlyIcelandIDA & IBRD totalIDA blendIDA onlyIDA totalIndiaIndonesiaIran, Islamic Rep.IraqIrelandIsraelItalyJamaicaJapanJordanKazakhstanKenyaKiribatiKorea, Dem. People’s Rep.Korea, Rep.KuwaitKyrgyz RepublicLao PDRLate-demographic dividendLatin America & Caribbean Latin America & Caribbean (excluding high income)Latin America & the Caribbean (IDA & IBRD countries)LatviaLeast developed countries: UN classificationLebanonLesothoLiberiaLibyaLiechtensteinLithuaniaLow & middle incomeLow incomeLower middle incomeLuxembourgMacao SAR, ChinaMacedonia, FYRMadagascarMalawiMaldivesMaliMaltaMarshall IslandsMauritaniaMauritiusMexicoMicronesia, Fed. Sts.Middle East & North AfricaMiddle East & North Africa (excluding high income)Middle East & North Africa (IDA & IBRD countries)Middle incomeMoldovaMongoliaMontenegroMoroccoMozambiqueMyanmarNamibiaNauruNepalNetherlandsNew ZealandNicaraguaNigerNigeriaNorth AmericaNorwayOECD membersOmanOther small statesPacific island small statesPakistanPanamaPapua New GuineaParaguayPeruPhilippinesPolandPortugalPost-demographic dividendPre-demographic dividendPuerto RicoQatarRomaniaRussian FederationRwandaSamoaSan MarinoSao Tome and PrincipeSaudi ArabiaSenegalSerbiaSeychellesSierra LeoneSloveniaSmall statesSolomon IslandsSomaliaSouth AfricaSouth AsiaSouth Asia (IDA & IBRD)South SudanSpainSri LankaSt. Kitts and NevisSt. LuciaSt. Vincent and the GrenadinesSub-Saharan Africa Sub-Saharan Africa (excluding high income)Sub-Saharan Africa (IDA & IBRD countries)SudanSurinameSwazilandSwedenSwitzerlandSyrian Arab RepublicTajikistanTanzaniaThailandTimor-LesteTogoTongaTrinidad and TobagoTunisiaTurkeyTuvaluUgandaUkraineUnited Arab EmiratesUnited KingdomUnited StatesUpper middle incomeUruguayUzbekistanVanuatuVenezuela, RBWest Bank and GazaWorldYemen, Rep.ZambiaZimbabwe Timeline:
This timeline shows a graph from 1972 to 2015 of Burkina Faso. No data until 1971. Number of actual observations by date: 37.
Source name:
World Development Indicators
Source organization:
United Nations Educational, Scientific, and Cultural Organization (UNESCO) Institute for Statistics.
Categories, topics:
Education
Last updated:
apr 23, 2017
Indicators value changes by year
Maximum:
92.568
jan 1, 1972
At the date of observation
Value
Absolute change
Change from previous value
jan 1, 1972
92.568
+92.568
0.0%
jan 1, 1973
92.111
-0.457
-0.49%
jan 1, 1978
90.658
-1.453
-1.58%
jan 1, 1979
90.326
-0.332
-0.37%
jan 1, 1980
89.914
-0.412
-0.46%
jan 1, 1981
89.195
-0.718
-0.8%
jan 1, 1982
88.512
-0.684
-0.77%
jan 1, 1983
87.494
-1.017
-1.15%
jan 1, 1984
86.346
-1.148
-1.31%
jan 1, 1985
85.486
-0.86
-1.0%
jan 1, 1986
83.98
-1.506
-1.76%
jan 1, 1987
82.328
-1.652
-1.97%
jan 1, 1988
81.207
-1.121
-1.36%
jan 1, 1989
80.709
-0.498
-0.61%
jan 1, 1990
80.257
-0.452
-0.56%
jan 1, 1992
78.633
-1.624
-2.02%
jan 1, 1993
78.166
-0.467
-0.59%
jan 1, 1994
77.299
-0.866
-1.11%
jan 1, 1995
76.327
-0.973
-1.26%
jan 1, 1996
75.058
-1.269
-1.66%
jan 1, 1999
71.704
-3.354
-4.47%
jan 1, 2000
70.977
-0.727
-1.01%
jan 1, 2001
69.633
-1.344
-1.89%
jan 1, 2002
68.446
-1.187
-1.7%
jan 1, 2003
68.94
+0.493
0.72%
jan 1, 2004
66.588
-2.352
-3.41%
jan 1, 2005
64.143
-2.446
-3.67%
jan 1, 2006
59.318
-4.824
-7.52%
jan 1, 2007
55.481
-3.838
-6.47%
jan 1, 2008
50.056
-5.424
-9.78%
jan 1, 2009
43.559
-6.498
-12.98%
jan 1, 2010
40.141
-3.417
-7.85%
jan 1, 2011
42.584
+2.443
6.09%
jan 1, 2012
37.717
-4.867
-11.43%
jan 1, 2013
36.261
-1.457
-3.86%
jan 1, 2014
35.066
-1.194
-3.29%
jan 1, 2015
33.84
-1.226
-3.5%
Ranking of countries by current statistics by years


Comments: