29
/
en
AIzaSyAYiBZKx7MnpbEhh9jyipgxe19OcubqV5w
April 1, 2024
171493
Kuwait
KWT
true
2
1
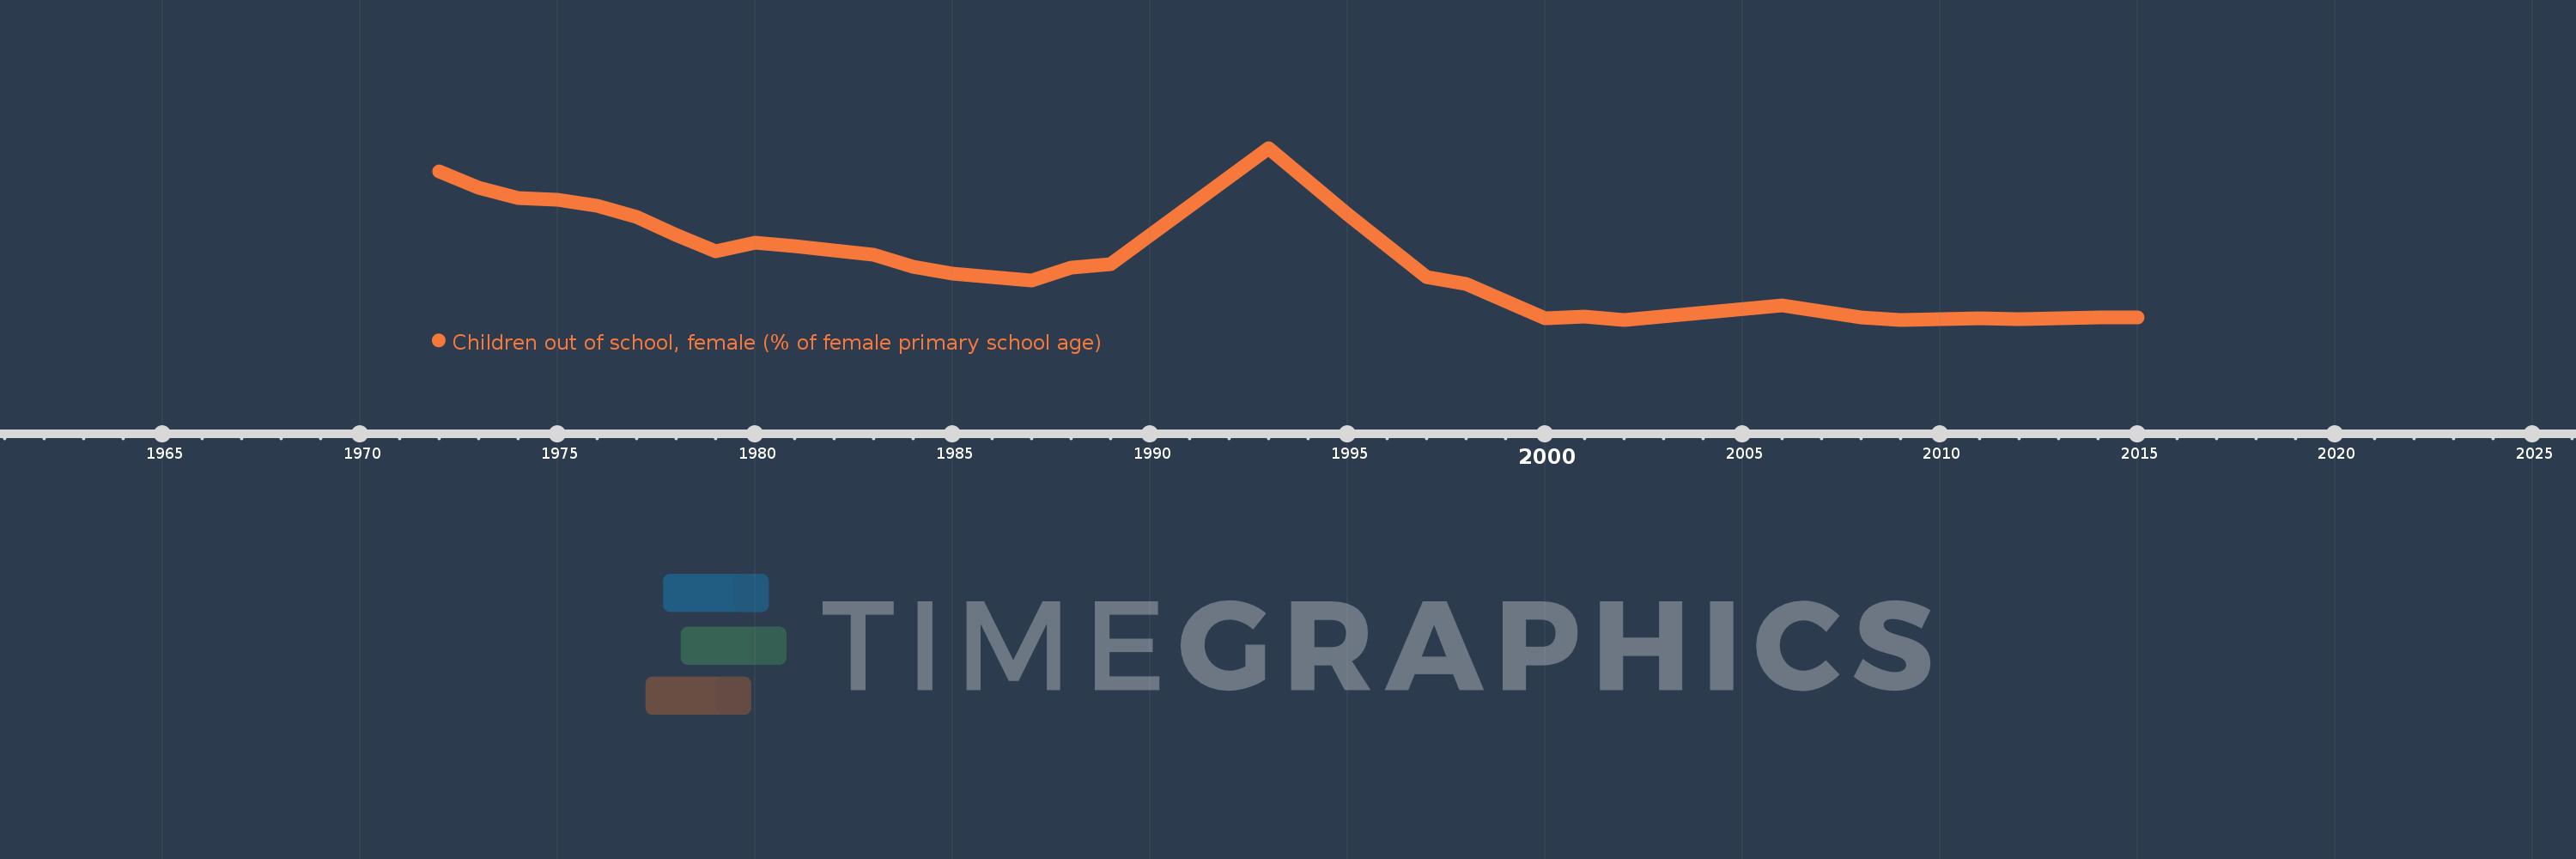
Children out of school, female (% of female primary school age)
2015,2014,2013,2012,2011,2009,2008,2006,2002,2001,2000,1998,1997,1995,1993,1989,1988,1987,1986,1985,1984,1983,1982,1981,1980,1979,1978,1977,1976,1975,1974,1973,1972
This statistics in other country:
AfghanistanAlbaniaAlgeriaAngolaAntigua and BarbudaArab WorldArgentinaArmeniaArubaAustraliaAustriaAzerbaijanBahamas, TheBahrainBangladeshBarbadosBelarusBelgiumBelizeBeninBermudaBhutanBoliviaBosnia and HerzegovinaBotswanaBrazilBrunei DarussalamBulgariaBurkina FasoBurundiCabo VerdeCambodiaCameroonCanadaCaribbean small statesCentral African RepublicCentral Europe and the BalticsChadChileChinaColombiaComorosCongo, Dem. Rep.Congo, Rep.Costa RicaCote d'IvoireCroatiaCubaCyprusDenmarkDjiboutiDominicaDominican RepublicEarly-demographic dividendEast Asia & PacificEast Asia & Pacific (excluding high income)East Asia & Pacific (IDA & IBRD countries)EcuadorEgypt, Arab Rep.El SalvadorEquatorial GuineaEritreaEstoniaEthiopiaEuro areaEurope & Central AsiaEurope & Central Asia (excluding high income)Europe & Central Asia (IDA & IBRD countries)European UnionFijiFinlandFragile and conflict affected situationsFranceGabonGambia, TheGeorgiaGhanaGreeceGrenadaGuatemalaGuineaGuinea-BissauGuyanaHaitiHeavily indebted poor countries (HIPC)High incomeHondurasHong Kong SAR, ChinaHungaryIBRD onlyIcelandIDA & IBRD totalIDA blendIDA onlyIDA totalIndiaIndonesiaIran, Islamic Rep.IraqIrelandIsraelItalyJamaicaJapanJordanKazakhstanKenyaKiribatiKorea, Dem. People’s Rep.Korea, Rep.KuwaitKyrgyz RepublicLao PDRLate-demographic dividendLatin America & Caribbean Latin America & Caribbean (excluding high income)Latin America & the Caribbean (IDA & IBRD countries)LatviaLeast developed countries: UN classificationLebanonLesothoLiberiaLibyaLiechtensteinLithuaniaLow & middle incomeLow incomeLower middle incomeLuxembourgMacao SAR, ChinaMacedonia, FYRMadagascarMalawiMaldivesMaliMaltaMarshall IslandsMauritaniaMauritiusMexicoMicronesia, Fed. Sts.Middle East & North AfricaMiddle East & North Africa (excluding high income)Middle East & North Africa (IDA & IBRD countries)Middle incomeMoldovaMongoliaMontenegroMoroccoMozambiqueMyanmarNamibiaNauruNepalNetherlandsNew ZealandNicaraguaNigerNigeriaNorth AmericaNorwayOECD membersOmanOther small statesPacific island small statesPakistanPanamaPapua New GuineaParaguayPeruPhilippinesPolandPortugalPost-demographic dividendPre-demographic dividendPuerto RicoQatarRomaniaRussian FederationRwandaSamoaSan MarinoSao Tome and PrincipeSaudi ArabiaSenegalSerbiaSeychellesSierra LeoneSloveniaSmall statesSolomon IslandsSomaliaSouth AfricaSouth AsiaSouth Asia (IDA & IBRD)South SudanSpainSri LankaSt. Kitts and NevisSt. LuciaSt. Vincent and the GrenadinesSub-Saharan Africa Sub-Saharan Africa (excluding high income)Sub-Saharan Africa (IDA & IBRD countries)SudanSurinameSwazilandSwedenSwitzerlandSyrian Arab RepublicTajikistanTanzaniaThailandTimor-LesteTogoTongaTrinidad and TobagoTunisiaTurkeyTuvaluUgandaUkraineUnited Arab EmiratesUnited KingdomUnited StatesUpper middle incomeUruguayUzbekistanVanuatuVenezuela, RBWest Bank and GazaWorldYemen, Rep.ZambiaZimbabwe Timeline:
This timeline shows a graph from 1972 to 2015 of Kuwait. No data until 1971. Number of actual observations by date: 33.
Source name:
World Development Indicators
Source organization:
United Nations Educational, Scientific, and Cultural Organization (UNESCO) Institute for Statistics.
Categories, topics:
Education
Last updated:
apr 23, 2017
Indicators value changes by year
Maximum:
53.497
jan 1, 1993
At the date of observation
Value
Absolute change
Change from previous value
jan 1, 1972
46.2
+46.2
0.0%
jan 1, 1973
41.188
-5.013
-10.85%
jan 1, 1974
37.988
-3.199
-7.77%
jan 1, 1975
37.422
-0.566
-1.49%
jan 1, 1976
35.396
-2.026
-5.41%
jan 1, 1977
31.95
-3.446
-9.74%
jan 1, 1978
26.498
-5.452
-17.07%
jan 1, 1979
21.411
-5.087
-19.2%
jan 1, 1980
24.064
+2.653
12.39%
jan 1, 1981
23.003
-1.061
-4.41%
jan 1, 1982
21.592
-1.411
-6.13%
jan 1, 1983
20.217
-1.376
-6.37%
jan 1, 1984
16.584
-3.632
-17.97%
jan 1, 1985
14.361
-2.223
-13.4%
jan 1, 1986
13.291
-1.07
-7.45%
jan 1, 1987
12.2
-1.091
-8.21%
jan 1, 1988
16.156
+3.956
32.42%
jan 1, 1989
17.415
+1.259
7.79%
jan 1, 1993
53.497
+36.082
207.19%
jan 1, 1995
32.921
-20.576
-38.46%
jan 1, 1997
13.287
-19.634
-59.64%
jan 1, 1998
11.156
-2.131
-16.04%
jan 1, 2000
0.531
-10.625
-95.24%
jan 1, 2001
0.916
+0.385
72.4%
jan 1, 2002
0.061
-0.855
-93.37%
jan 1, 2006
4.446
+4.386
7.23K%
jan 1, 2008
0.848
-3.598
-80.93%
jan 1, 2009
0.044
-0.804
-94.8%
jan 1, 2011
0.51
+0.466
1.06K%
jan 1, 2012
0.336
-0.174
-34.17%
jan 1, 2013
0.529
+0.193
57.42%
jan 1, 2014
0.696
+0.167
31.55%
jan 1, 2015
0.666
-0.029
-4.2%
Ranking of countries by current statistics by years


Comments: