29
/
en
AIzaSyAYiBZKx7MnpbEhh9jyipgxe19OcubqV5w
April 1, 2024
285619
Zambia
ZMB
true
2
1
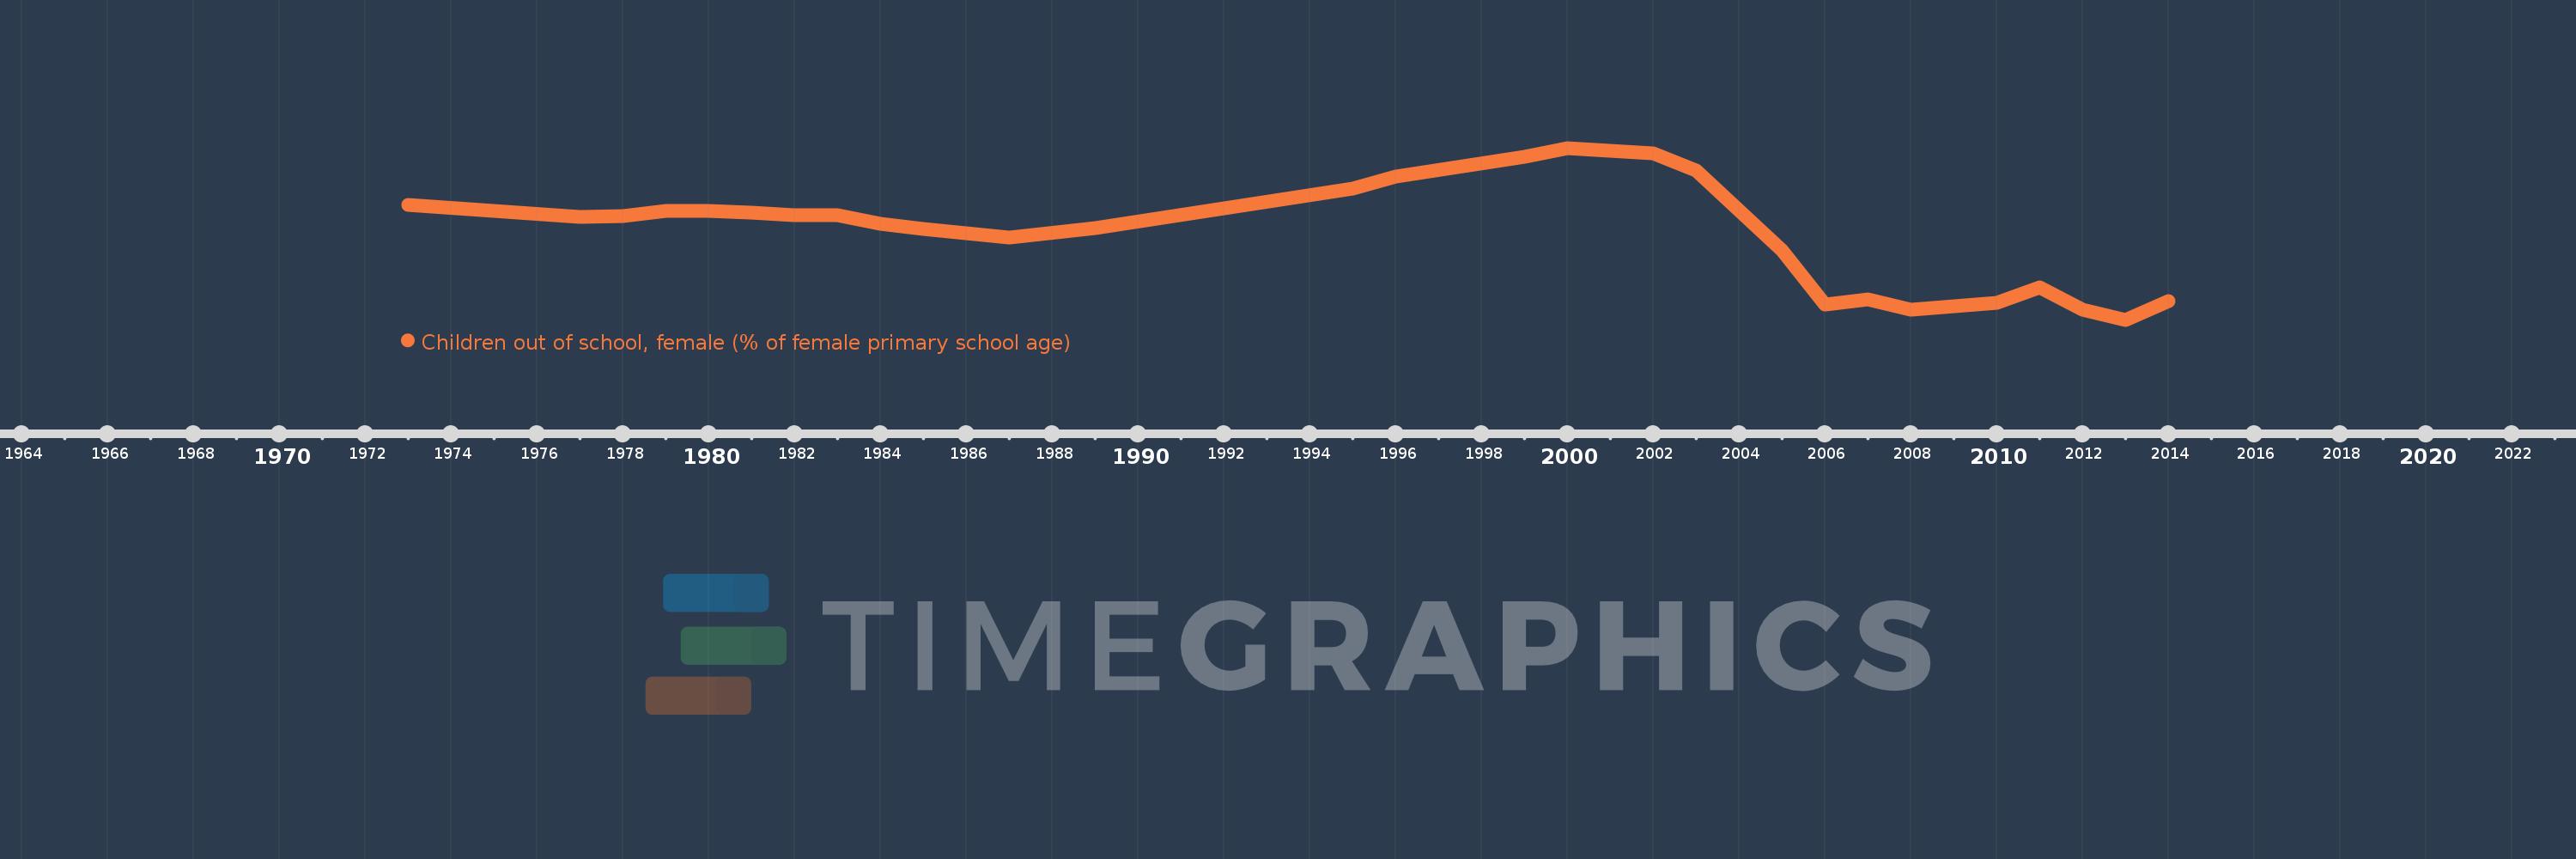
Children out of school, female (% of female primary school age)
2014,2013,2012,2011,2010,2008,2007,2006,2005,2003,2002,2001,2000,1999,1996,1995,1989,1987,1985,1984,1983,1982,1981,1980,1979,1978,1977,1973
This statistics in other country:
AfghanistanAlbaniaAlgeriaAngolaAntigua and BarbudaArab WorldArgentinaArmeniaArubaAustraliaAustriaAzerbaijanBahamas, TheBahrainBangladeshBarbadosBelarusBelgiumBelizeBeninBermudaBhutanBoliviaBosnia and HerzegovinaBotswanaBrazilBrunei DarussalamBulgariaBurkina FasoBurundiCabo VerdeCambodiaCameroonCanadaCaribbean small statesCentral African RepublicCentral Europe and the BalticsChadChileChinaColombiaComorosCongo, Dem. Rep.Congo, Rep.Costa RicaCote d'IvoireCroatiaCubaCyprusDenmarkDjiboutiDominicaDominican RepublicEarly-demographic dividendEast Asia & PacificEast Asia & Pacific (excluding high income)East Asia & Pacific (IDA & IBRD countries)EcuadorEgypt, Arab Rep.El SalvadorEquatorial GuineaEritreaEstoniaEthiopiaEuro areaEurope & Central AsiaEurope & Central Asia (excluding high income)Europe & Central Asia (IDA & IBRD countries)European UnionFijiFinlandFragile and conflict affected situationsFranceGabonGambia, TheGeorgiaGhanaGreeceGrenadaGuatemalaGuineaGuinea-BissauGuyanaHaitiHeavily indebted poor countries (HIPC)High incomeHondurasHong Kong SAR, ChinaHungaryIBRD onlyIcelandIDA & IBRD totalIDA blendIDA onlyIDA totalIndiaIndonesiaIran, Islamic Rep.IraqIrelandIsraelItalyJamaicaJapanJordanKazakhstanKenyaKiribatiKorea, Dem. People’s Rep.Korea, Rep.KuwaitKyrgyz RepublicLao PDRLate-demographic dividendLatin America & Caribbean Latin America & Caribbean (excluding high income)Latin America & the Caribbean (IDA & IBRD countries)LatviaLeast developed countries: UN classificationLebanonLesothoLiberiaLibyaLiechtensteinLithuaniaLow & middle incomeLow incomeLower middle incomeLuxembourgMacao SAR, ChinaMacedonia, FYRMadagascarMalawiMaldivesMaliMaltaMarshall IslandsMauritaniaMauritiusMexicoMicronesia, Fed. Sts.Middle East & North AfricaMiddle East & North Africa (excluding high income)Middle East & North Africa (IDA & IBRD countries)Middle incomeMoldovaMongoliaMontenegroMoroccoMozambiqueMyanmarNamibiaNauruNepalNetherlandsNew ZealandNicaraguaNigerNigeriaNorth AmericaNorwayOECD membersOmanOther small statesPacific island small statesPakistanPanamaPapua New GuineaParaguayPeruPhilippinesPolandPortugalPost-demographic dividendPre-demographic dividendPuerto RicoQatarRomaniaRussian FederationRwandaSamoaSan MarinoSao Tome and PrincipeSaudi ArabiaSenegalSerbiaSeychellesSierra LeoneSloveniaSmall statesSolomon IslandsSomaliaSouth AfricaSouth AsiaSouth Asia (IDA & IBRD)South SudanSpainSri LankaSt. Kitts and NevisSt. LuciaSt. Vincent and the GrenadinesSub-Saharan Africa Sub-Saharan Africa (excluding high income)Sub-Saharan Africa (IDA & IBRD countries)SudanSurinameSwazilandSwedenSwitzerlandSyrian Arab RepublicTajikistanTanzaniaThailandTimor-LesteTogoTongaTrinidad and TobagoTunisiaTurkeyTuvaluUgandaUkraineUnited Arab EmiratesUnited KingdomUnited StatesUpper middle incomeUruguayUzbekistanVanuatuVenezuela, RBWest Bank and GazaWorldYemen, Rep.ZambiaZimbabwe Timeline:
This timeline shows a graph from 1973 to 2014 of Zambia. No data until 1972. Number of actual observations by date: 28.
Source name:
World Development Indicators
Source organization:
United Nations Educational, Scientific, and Cultural Organization (UNESCO) Institute for Statistics.
Categories, topics:
Education
Last updated:
apr 23, 2017
Indicators value changes by year
Maximum:
36.276
jan 1, 2000
At the date of observation
Value
Absolute change
Change from previous value
jan 1, 1973
26.413
+26.413
0.0%
jan 1, 1977
24.471
-1.942
-7.35%
jan 1, 1978
24.547
+0.076
0.31%
jan 1, 1979
25.38
+0.833
3.39%
jan 1, 1980
25.43
+0.05
0.2%
jan 1, 1981
25.133
-0.297
-1.17%
jan 1, 1982
24.741
-0.392
-1.56%
jan 1, 1983
24.686
-0.055
-0.22%
jan 1, 1984
23.17
-1.516
-6.14%
jan 1, 1985
22.275
-0.895
-3.86%
jan 1, 1987
20.799
-1.476
-6.63%
jan 1, 1989
22.446
+1.647
7.92%
jan 1, 1995
29.309
+6.863
30.58%
jan 1, 1996
31.329
+2.02
6.89%
jan 1, 1999
34.818
+3.489
11.14%
jan 1, 2000
36.276
+1.458
4.19%
jan 1, 2001
35.748
-0.528
-1.46%
jan 1, 2002
35.409
-0.338
-0.95%
jan 1, 2003
32.398
-3.011
-8.5%
jan 1, 2005
18.578
-13.82
-42.66%
jan 1, 2006
9.346
-9.232
-49.69%
jan 1, 2007
10.21
+0.864
9.24%
jan 1, 2008
8.428
-1.782
-17.46%
jan 1, 2010
9.638
+1.21
14.36%
jan 1, 2011
12.302
+2.664
27.64%
jan 1, 2012
8.511
-3.791
-30.82%
jan 1, 2013
6.715
-1.796
-21.11%
jan 1, 2014
9.972
+3.258
48.52%
Ranking of countries by current statistics by years


Comments: