29
/
en
AIzaSyAYiBZKx7MnpbEhh9jyipgxe19OcubqV5w
April 1, 2024
264326
Togo
TGO
true
2
1
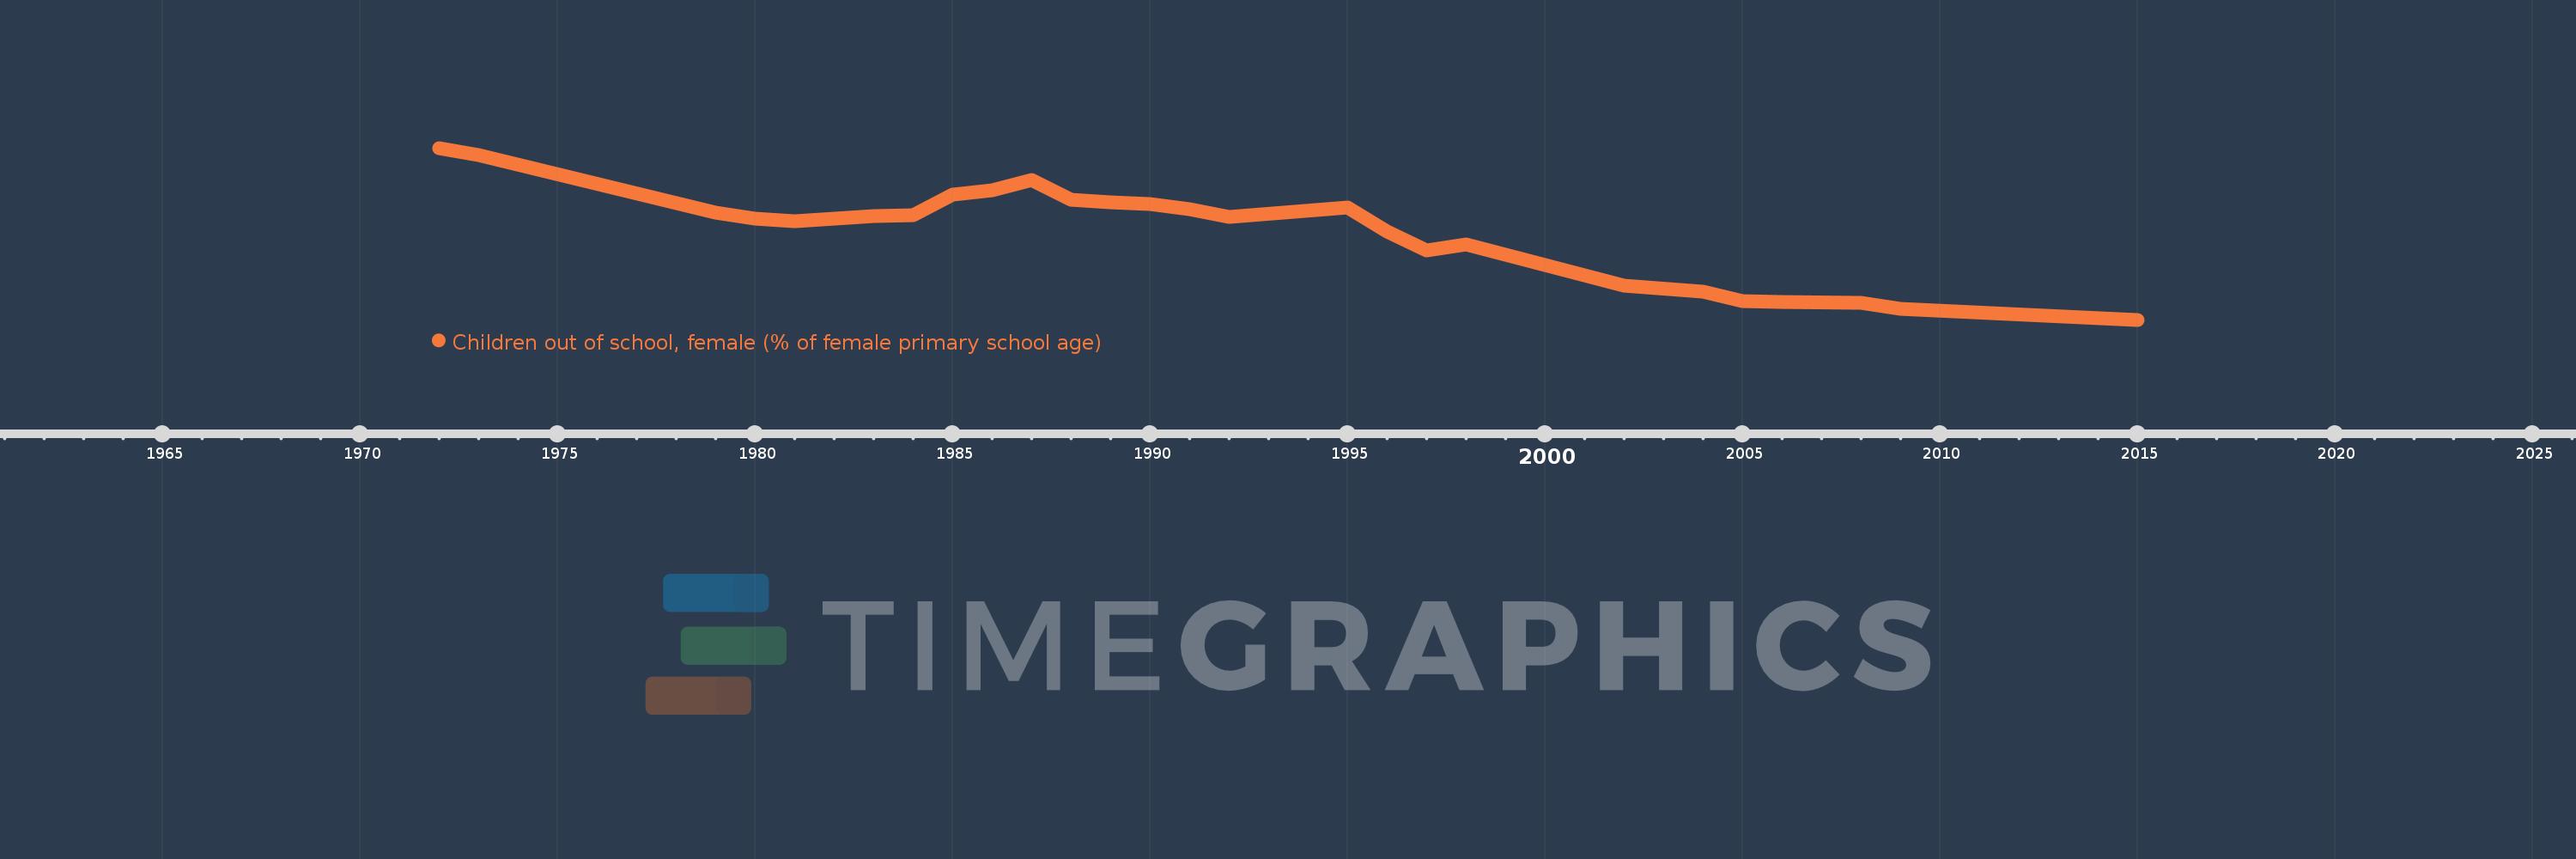
Children out of school, female (% of female primary school age)
2015,2009,2008,2006,2005,2004,2002,1998,1997,1996,1995,1992,1991,1990,1989,1988,1987,1986,1985,1984,1983,1981,1980,1979,1973,1972
This statistics in other country:
AfghanistanAlbaniaAlgeriaAngolaAntigua and BarbudaArab WorldArgentinaArmeniaArubaAustraliaAustriaAzerbaijanBahamas, TheBahrainBangladeshBarbadosBelarusBelgiumBelizeBeninBermudaBhutanBoliviaBosnia and HerzegovinaBotswanaBrazilBrunei DarussalamBulgariaBurkina FasoBurundiCabo VerdeCambodiaCameroonCanadaCaribbean small statesCentral African RepublicCentral Europe and the BalticsChadChileChinaColombiaComorosCongo, Dem. Rep.Congo, Rep.Costa RicaCote d'IvoireCroatiaCubaCyprusDenmarkDjiboutiDominicaDominican RepublicEarly-demographic dividendEast Asia & PacificEast Asia & Pacific (excluding high income)East Asia & Pacific (IDA & IBRD countries)EcuadorEgypt, Arab Rep.El SalvadorEquatorial GuineaEritreaEstoniaEthiopiaEuro areaEurope & Central AsiaEurope & Central Asia (excluding high income)Europe & Central Asia (IDA & IBRD countries)European UnionFijiFinlandFragile and conflict affected situationsFranceGabonGambia, TheGeorgiaGhanaGreeceGrenadaGuatemalaGuineaGuinea-BissauGuyanaHaitiHeavily indebted poor countries (HIPC)High incomeHondurasHong Kong SAR, ChinaHungaryIBRD onlyIcelandIDA & IBRD totalIDA blendIDA onlyIDA totalIndiaIndonesiaIran, Islamic Rep.IraqIrelandIsraelItalyJamaicaJapanJordanKazakhstanKenyaKiribatiKorea, Dem. People’s Rep.Korea, Rep.KuwaitKyrgyz RepublicLao PDRLate-demographic dividendLatin America & Caribbean Latin America & Caribbean (excluding high income)Latin America & the Caribbean (IDA & IBRD countries)LatviaLeast developed countries: UN classificationLebanonLesothoLiberiaLibyaLiechtensteinLithuaniaLow & middle incomeLow incomeLower middle incomeLuxembourgMacao SAR, ChinaMacedonia, FYRMadagascarMalawiMaldivesMaliMaltaMarshall IslandsMauritaniaMauritiusMexicoMicronesia, Fed. Sts.Middle East & North AfricaMiddle East & North Africa (excluding high income)Middle East & North Africa (IDA & IBRD countries)Middle incomeMoldovaMongoliaMontenegroMoroccoMozambiqueMyanmarNamibiaNauruNepalNetherlandsNew ZealandNicaraguaNigerNigeriaNorth AmericaNorwayOECD membersOmanOther small statesPacific island small statesPakistanPanamaPapua New GuineaParaguayPeruPhilippinesPolandPortugalPost-demographic dividendPre-demographic dividendPuerto RicoQatarRomaniaRussian FederationRwandaSamoaSan MarinoSao Tome and PrincipeSaudi ArabiaSenegalSerbiaSeychellesSierra LeoneSloveniaSmall statesSolomon IslandsSomaliaSouth AfricaSouth AsiaSouth Asia (IDA & IBRD)South SudanSpainSri LankaSt. Kitts and NevisSt. LuciaSt. Vincent and the GrenadinesSub-Saharan Africa Sub-Saharan Africa (excluding high income)Sub-Saharan Africa (IDA & IBRD countries)SudanSurinameSwazilandSwedenSwitzerlandSyrian Arab RepublicTajikistanTanzaniaThailandTimor-LesteTogoTongaTrinidad and TobagoTunisiaTurkeyTuvaluUgandaUkraineUnited Arab EmiratesUnited KingdomUnited StatesUpper middle incomeUruguayUzbekistanVanuatuVenezuela, RBWest Bank and GazaWorldYemen, Rep.ZambiaZimbabwe Timeline:
This timeline shows a graph from 1972 to 2015 of Togo. No data until 1971. Number of actual observations by date: 26.
Source name:
World Development Indicators
Source organization:
United Nations Educational, Scientific, and Cultural Organization (UNESCO) Institute for Statistics.
Categories, topics:
Education
Last updated:
apr 23, 2017
Indicators value changes by year
Minimum:
10.212
jan 1, 2015
Maximum:
67.771
jan 1, 1972
At the date of observation
Value
Absolute change
Change from previous value
jan 1, 1972
67.771
+67.771
0.0%
jan 1, 1973
65.478
-2.292
-3.38%
jan 1, 1979
46.205
-19.273
-29.43%
jan 1, 1980
44.102
-2.102
-4.55%
jan 1, 1981
43.189
-0.913
-2.07%
jan 1, 1983
45.014
+1.825
4.23%
jan 1, 1984
45.287
+0.273
0.61%
jan 1, 1985
52.235
+6.948
15.34%
jan 1, 1986
53.669
+1.434
2.74%
jan 1, 1987
57.13
+3.461
6.45%
jan 1, 1988
50.413
-6.717
-11.76%
jan 1, 1989
49.486
-0.928
-1.84%
jan 1, 1990
49.105
-0.381
-0.77%
jan 1, 1991
47.267
-1.838
-3.74%
jan 1, 1992
44.528
-2.739
-5.79%
jan 1, 1995
47.813
+3.286
7.38%
jan 1, 1996
39.806
-8.007
-16.75%
jan 1, 1997
33.575
-6.231
-15.65%
jan 1, 1998
35.338
+1.763
5.25%
jan 1, 2002
21.681
-13.657
-38.65%
jan 1, 2004
19.639
-2.043
-9.42%
jan 1, 2005
16.445
-3.194
-16.26%
jan 1, 2006
16.265
-0.179
-1.09%
jan 1, 2008
15.938
-0.327
-2.01%
jan 1, 2009
13.973
-1.965
-12.33%
jan 1, 2015
10.212
-3.761
-26.92%
Ranking of countries by current statistics by years


Comments: