29
/
en
AIzaSyAYiBZKx7MnpbEhh9jyipgxe19OcubqV5w
April 1, 2024
47961
Middle East & North Africa
MEA
false
2
1
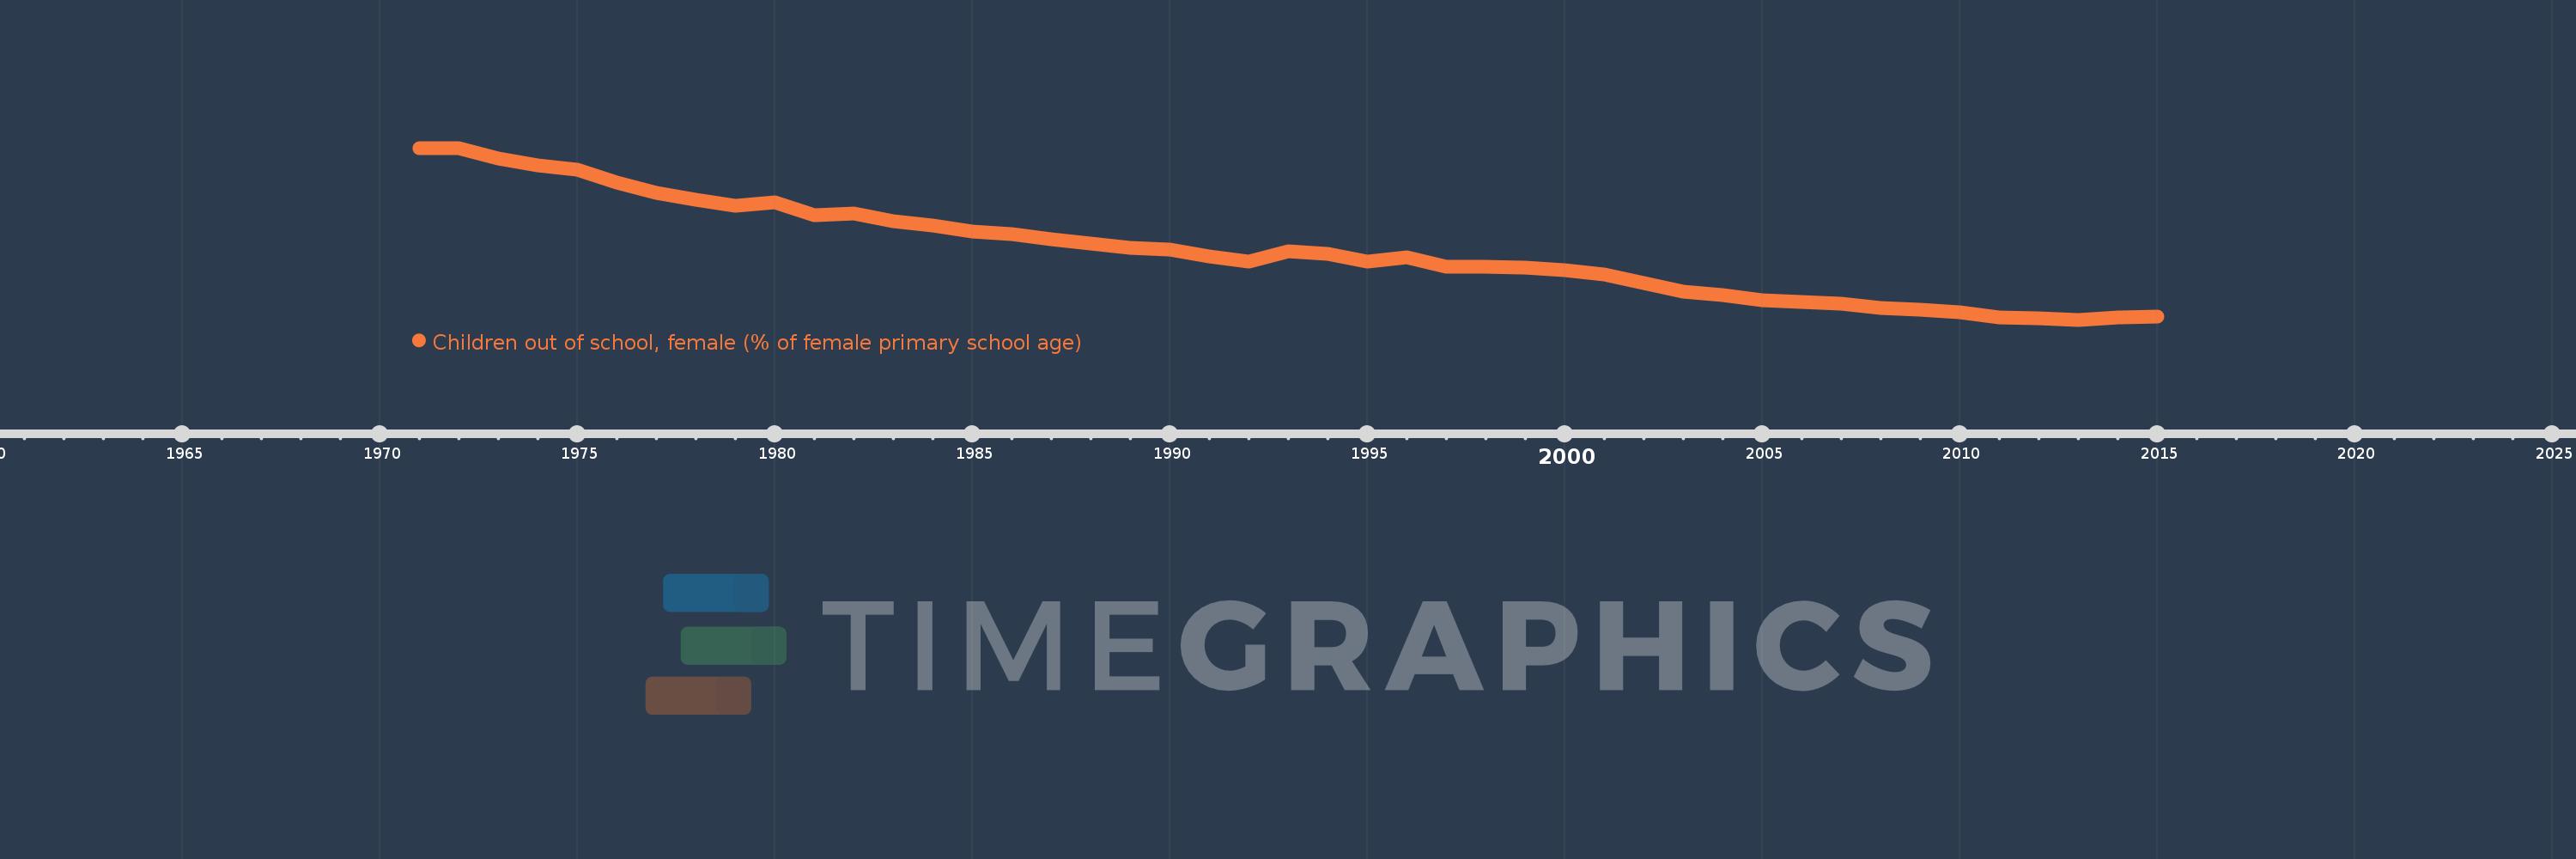
Children out of school, female (% of female primary school age)
2015,2014,2013,2012,2011,2010,2009,2008,2007,2006,2005,2004,2003,2002,2001,2000,1999,1998,1997,1996,1995,1994,1993,1992,1991,1990,1989,1988,1987,1986,1985,1984,1983,1982,1981,1980,1979,1978,1977,1976,1975,1974,1973,1972,1971
This statistics in other country:
AfghanistanAlbaniaAlgeriaAngolaAntigua and BarbudaArab WorldArgentinaArmeniaArubaAustraliaAustriaAzerbaijanBahamas, TheBahrainBangladeshBarbadosBelarusBelgiumBelizeBeninBermudaBhutanBoliviaBosnia and HerzegovinaBotswanaBrazilBrunei DarussalamBulgariaBurkina FasoBurundiCabo VerdeCambodiaCameroonCanadaCaribbean small statesCentral African RepublicCentral Europe and the BalticsChadChileChinaColombiaComorosCongo, Dem. Rep.Congo, Rep.Costa RicaCote d'IvoireCroatiaCubaCyprusDenmarkDjiboutiDominicaDominican RepublicEarly-demographic dividendEast Asia & PacificEast Asia & Pacific (excluding high income)East Asia & Pacific (IDA & IBRD countries)EcuadorEgypt, Arab Rep.El SalvadorEquatorial GuineaEritreaEstoniaEthiopiaEuro areaEurope & Central AsiaEurope & Central Asia (excluding high income)Europe & Central Asia (IDA & IBRD countries)European UnionFijiFinlandFragile and conflict affected situationsFranceGabonGambia, TheGeorgiaGhanaGreeceGrenadaGuatemalaGuineaGuinea-BissauGuyanaHaitiHeavily indebted poor countries (HIPC)High incomeHondurasHong Kong SAR, ChinaHungaryIBRD onlyIcelandIDA & IBRD totalIDA blendIDA onlyIDA totalIndiaIndonesiaIran, Islamic Rep.IraqIrelandIsraelItalyJamaicaJapanJordanKazakhstanKenyaKiribatiKorea, Dem. People’s Rep.Korea, Rep.KuwaitKyrgyz RepublicLao PDRLate-demographic dividendLatin America & Caribbean Latin America & Caribbean (excluding high income)Latin America & the Caribbean (IDA & IBRD countries)LatviaLeast developed countries: UN classificationLebanonLesothoLiberiaLibyaLiechtensteinLithuaniaLow & middle incomeLow incomeLower middle incomeLuxembourgMacao SAR, ChinaMacedonia, FYRMadagascarMalawiMaldivesMaliMaltaMarshall IslandsMauritaniaMauritiusMexicoMicronesia, Fed. Sts.Middle East & North AfricaMiddle East & North Africa (excluding high income)Middle East & North Africa (IDA & IBRD countries)Middle incomeMoldovaMongoliaMontenegroMoroccoMozambiqueMyanmarNamibiaNauruNepalNetherlandsNew ZealandNicaraguaNigerNigeriaNorth AmericaNorwayOECD membersOmanOther small statesPacific island small statesPakistanPanamaPapua New GuineaParaguayPeruPhilippinesPolandPortugalPost-demographic dividendPre-demographic dividendPuerto RicoQatarRomaniaRussian FederationRwandaSamoaSan MarinoSao Tome and PrincipeSaudi ArabiaSenegalSerbiaSeychellesSierra LeoneSloveniaSmall statesSolomon IslandsSomaliaSouth AfricaSouth AsiaSouth Asia (IDA & IBRD)South SudanSpainSri LankaSt. Kitts and NevisSt. LuciaSt. Vincent and the GrenadinesSub-Saharan Africa Sub-Saharan Africa (excluding high income)Sub-Saharan Africa (IDA & IBRD countries)SudanSurinameSwazilandSwedenSwitzerlandSyrian Arab RepublicTajikistanTanzaniaThailandTimor-LesteTogoTongaTrinidad and TobagoTunisiaTurkeyTuvaluUgandaUkraineUnited Arab EmiratesUnited KingdomUnited StatesUpper middle incomeUruguayUzbekistanVanuatuVenezuela, RBWest Bank and GazaWorldYemen, Rep.ZambiaZimbabwe Timeline:
This timeline shows a graph from 1971 to 2015 of Middle East & North Africa. No data until 1970. Number of actual observations by date: 45.
Source name:
World Development Indicators
Source organization:
United Nations Educational, Scientific, and Cultural Organization (UNESCO) Institute for Statistics.
Categories, topics:
Education
Last updated:
apr 23, 2017
Indicators value changes by year
Maximum:
54.884
jan 1, 1972
At the date of observation
Value
Absolute change
Change from previous value
jan 1, 1971
54.811
+54.811
0.0%
jan 1, 1972
54.884
+0.073
0.13%
jan 1, 1973
51.786
-3.098
-5.65%
jan 1, 1974
49.936
-1.85
-3.57%
jan 1, 1975
48.79
-1.146
-2.3%
jan 1, 1976
44.996
-3.793
-7.77%
jan 1, 1977
42.152
-2.844
-6.32%
jan 1, 1978
40.033
-2.119
-5.03%
jan 1, 1979
38.345
-1.689
-4.22%
jan 1, 1980
39.357
+1.012
2.64%
jan 1, 1981
35.791
-3.566
-9.06%
jan 1, 1982
36.118
+0.327
0.91%
jan 1, 1983
34.064
-2.054
-5.69%
jan 1, 1984
32.858
-1.205
-3.54%
jan 1, 1985
31.16
-1.699
-5.17%
jan 1, 1986
30.281
-0.879
-2.82%
jan 1, 1987
28.896
-1.385
-4.57%
jan 1, 1988
27.56
-1.336
-4.62%
jan 1, 1989
26.303
-1.257
-4.56%
jan 1, 1990
26.03
-0.274
-1.04%
jan 1, 1991
23.889
-2.14
-8.22%
jan 1, 1992
22.536
-1.353
-5.66%
jan 1, 1993
25.438
+2.902
12.88%
jan 1, 1994
24.796
-0.642
-2.52%
jan 1, 1995
22.466
-2.33
-9.4%
jan 1, 1996
23.837
+1.371
6.1%
jan 1, 1997
21.14
-2.697
-11.31%
jan 1, 1998
21.125
-0.016
-0.07%
jan 1, 1999
20.672
-0.452
-2.14%
jan 1, 2000
20.078
-0.595
-2.88%
jan 1, 2001
18.888
-1.19
-5.93%
jan 1, 2002
16.298
-2.59
-13.71%
jan 1, 2003
14.018
-2.279
-13.99%
jan 1, 2004
12.875
-1.143
-8.16%
jan 1, 2005
11.568
-1.307
-10.15%
jan 1, 2006
10.896
-0.672
-5.81%
jan 1, 2007
10.529
-0.367
-3.37%
jan 1, 2008
9.231
-1.298
-12.33%
jan 1, 2009
8.685
-0.546
-5.91%
jan 1, 2010
8.112
-0.573
-6.6%
jan 1, 2011
6.693
-1.419
-17.49%
jan 1, 2012
6.411
-0.282
-4.21%
jan 1, 2013
5.924
-0.487
-7.6%
jan 1, 2014
6.494
+0.569
9.61%
jan 1, 2015
6.785
+0.291
4.49%
Ranking of countries by current statistics by years


Comments: