29
/
en
AIzaSyAYiBZKx7MnpbEhh9jyipgxe19OcubqV5w
April 1, 2024
44093
Least developed countries: UN classification
LDC
false
2
1
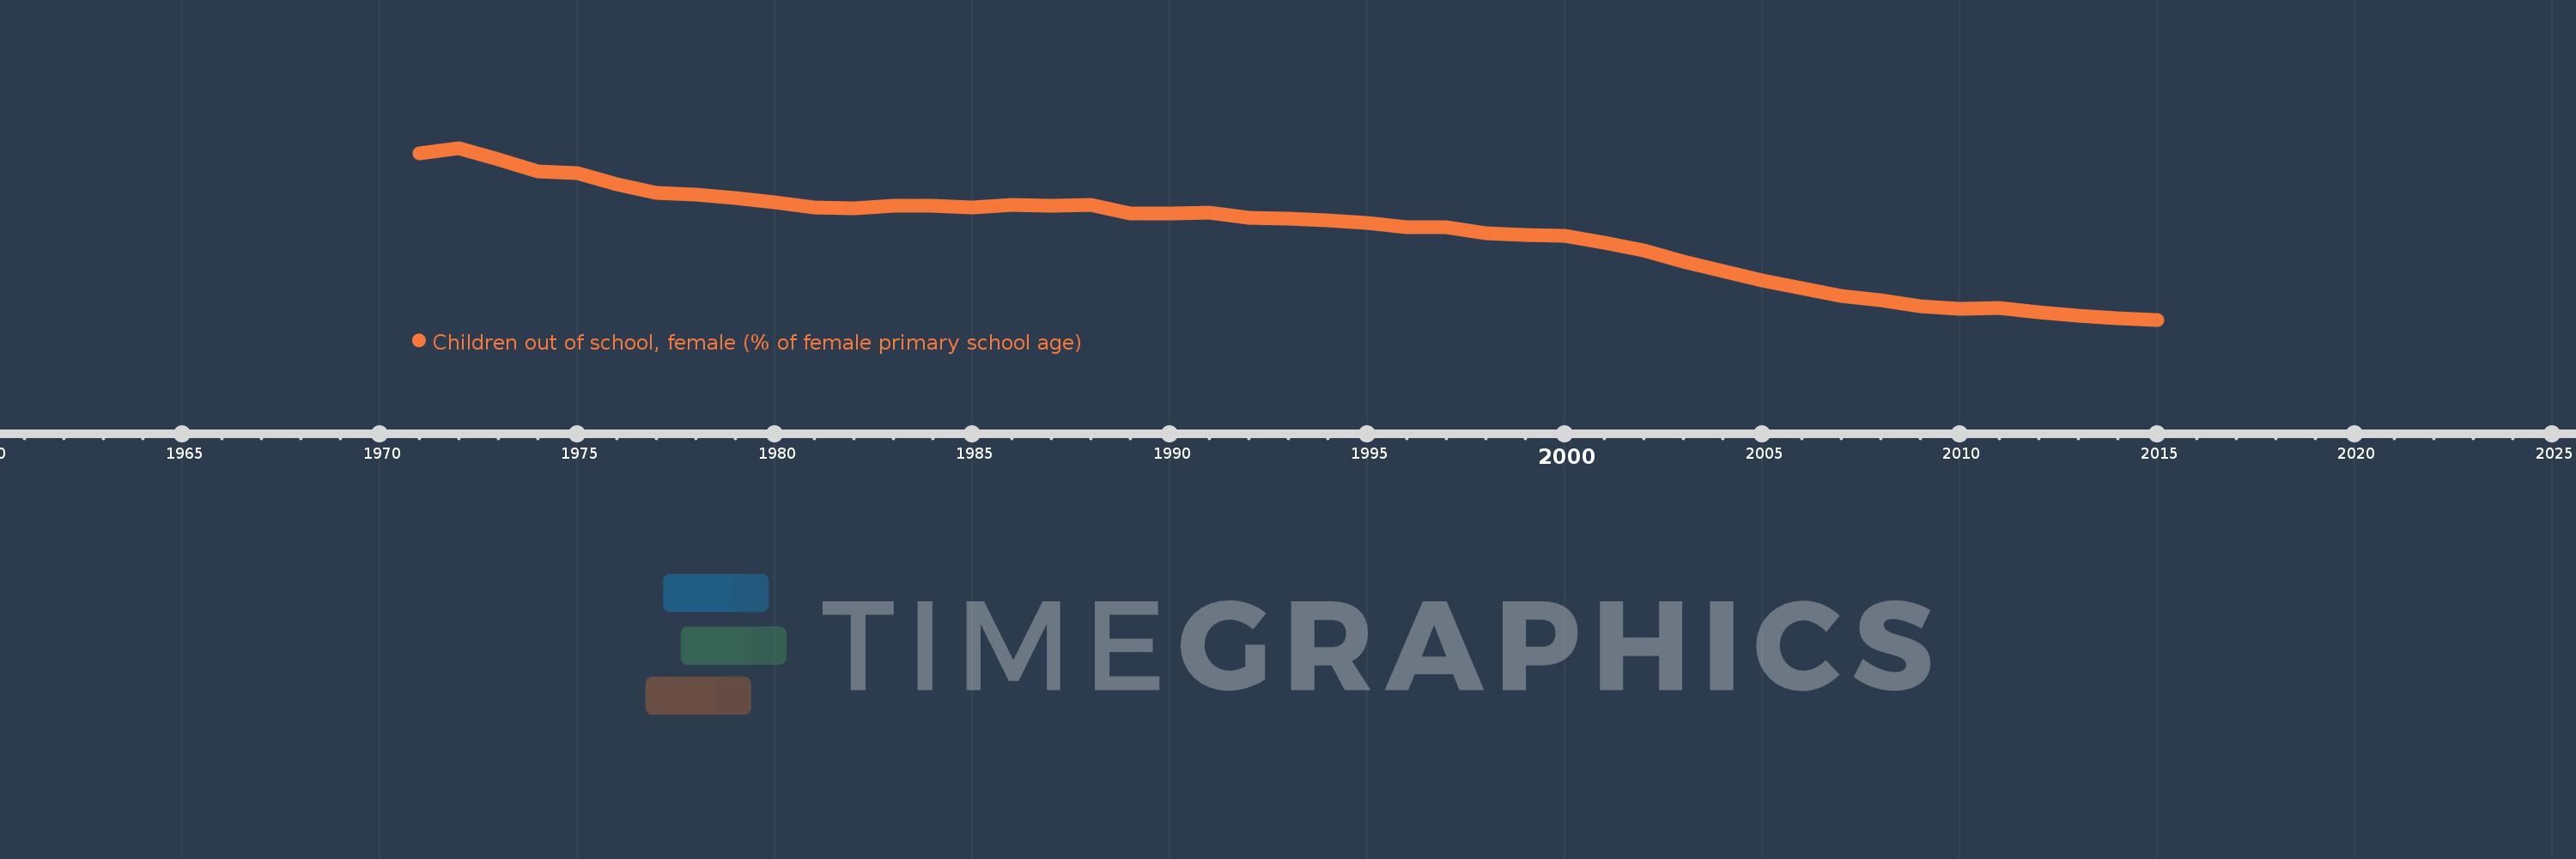
Children out of school, female (% of female primary school age)
2015,2014,2013,2012,2011,2010,2009,2008,2007,2006,2005,2004,2003,2002,2001,2000,1999,1998,1997,1996,1995,1994,1993,1992,1991,1990,1989,1988,1987,1986,1985,1984,1983,1982,1981,1980,1979,1978,1977,1976,1975,1974,1973,1972,1971
This statistics in other country:
AfghanistanAlbaniaAlgeriaAngolaAntigua and BarbudaArab WorldArgentinaArmeniaArubaAustraliaAustriaAzerbaijanBahamas, TheBahrainBangladeshBarbadosBelarusBelgiumBelizeBeninBermudaBhutanBoliviaBosnia and HerzegovinaBotswanaBrazilBrunei DarussalamBulgariaBurkina FasoBurundiCabo VerdeCambodiaCameroonCanadaCaribbean small statesCentral African RepublicCentral Europe and the BalticsChadChileChinaColombiaComorosCongo, Dem. Rep.Congo, Rep.Costa RicaCote d'IvoireCroatiaCubaCyprusDenmarkDjiboutiDominicaDominican RepublicEarly-demographic dividendEast Asia & PacificEast Asia & Pacific (excluding high income)East Asia & Pacific (IDA & IBRD countries)EcuadorEgypt, Arab Rep.El SalvadorEquatorial GuineaEritreaEstoniaEthiopiaEuro areaEurope & Central AsiaEurope & Central Asia (excluding high income)Europe & Central Asia (IDA & IBRD countries)European UnionFijiFinlandFragile and conflict affected situationsFranceGabonGambia, TheGeorgiaGhanaGreeceGrenadaGuatemalaGuineaGuinea-BissauGuyanaHaitiHeavily indebted poor countries (HIPC)High incomeHondurasHong Kong SAR, ChinaHungaryIBRD onlyIcelandIDA & IBRD totalIDA blendIDA onlyIDA totalIndiaIndonesiaIran, Islamic Rep.IraqIrelandIsraelItalyJamaicaJapanJordanKazakhstanKenyaKiribatiKorea, Dem. People’s Rep.Korea, Rep.KuwaitKyrgyz RepublicLao PDRLate-demographic dividendLatin America & Caribbean Latin America & Caribbean (excluding high income)Latin America & the Caribbean (IDA & IBRD countries)LatviaLeast developed countries: UN classificationLebanonLesothoLiberiaLibyaLiechtensteinLithuaniaLow & middle incomeLow incomeLower middle incomeLuxembourgMacao SAR, ChinaMacedonia, FYRMadagascarMalawiMaldivesMaliMaltaMarshall IslandsMauritaniaMauritiusMexicoMicronesia, Fed. Sts.Middle East & North AfricaMiddle East & North Africa (excluding high income)Middle East & North Africa (IDA & IBRD countries)Middle incomeMoldovaMongoliaMontenegroMoroccoMozambiqueMyanmarNamibiaNauruNepalNetherlandsNew ZealandNicaraguaNigerNigeriaNorth AmericaNorwayOECD membersOmanOther small statesPacific island small statesPakistanPanamaPapua New GuineaParaguayPeruPhilippinesPolandPortugalPost-demographic dividendPre-demographic dividendPuerto RicoQatarRomaniaRussian FederationRwandaSamoaSan MarinoSao Tome and PrincipeSaudi ArabiaSenegalSerbiaSeychellesSierra LeoneSloveniaSmall statesSolomon IslandsSomaliaSouth AfricaSouth AsiaSouth Asia (IDA & IBRD)South SudanSpainSri LankaSt. Kitts and NevisSt. LuciaSt. Vincent and the GrenadinesSub-Saharan Africa Sub-Saharan Africa (excluding high income)Sub-Saharan Africa (IDA & IBRD countries)SudanSurinameSwazilandSwedenSwitzerlandSyrian Arab RepublicTajikistanTanzaniaThailandTimor-LesteTogoTongaTrinidad and TobagoTunisiaTurkeyTuvaluUgandaUkraineUnited Arab EmiratesUnited KingdomUnited StatesUpper middle incomeUruguayUzbekistanVanuatuVenezuela, RBWest Bank and GazaWorldYemen, Rep.ZambiaZimbabwe Timeline:
This timeline shows a graph from 1971 to 2015 of Least developed countries: UN classification. No data until 1970. Number of actual observations by date: 45.
Source name:
World Development Indicators
Source organization:
United Nations Educational, Scientific, and Cultural Organization (UNESCO) Institute for Statistics.
Categories, topics:
Education
Last updated:
apr 23, 2017
Indicators value changes by year
Minimum:
19.548
jan 1, 2015
Maximum:
73.756
jan 1, 1972
At the date of observation
Value
Absolute change
Change from previous value
jan 1, 1971
72.039
+72.039
0.0%
jan 1, 1972
73.756
+1.717
2.38%
jan 1, 1973
70.094
-3.662
-4.97%
jan 1, 1974
66.332
-3.762
-5.37%
jan 1, 1975
65.889
-0.443
-0.67%
jan 1, 1976
62.336
-3.553
-5.39%
jan 1, 1977
59.615
-2.721
-4.37%
jan 1, 1978
58.914
-0.7
-1.17%
jan 1, 1979
57.887
-1.027
-1.74%
jan 1, 1980
56.596
-1.292
-2.23%
jan 1, 1981
54.903
-1.693
-2.99%
jan 1, 1982
54.57
-0.333
-0.61%
jan 1, 1983
55.623
+1.053
1.93%
jan 1, 1984
55.546
-0.077
-0.14%
jan 1, 1985
55.033
-0.513
-0.92%
jan 1, 1986
55.798
+0.765
1.39%
jan 1, 1987
55.579
-0.218
-0.39%
jan 1, 1988
55.896
+0.316
0.57%
jan 1, 1989
53.021
-2.874
-5.14%
jan 1, 1990
53.072
+0.051
0.1%
jan 1, 1991
53.373
+0.301
0.57%
jan 1, 1992
51.658
-1.715
-3.21%
jan 1, 1993
51.323
-0.334
-0.65%
jan 1, 1994
51.021
-0.302
-0.59%
jan 1, 1995
50.005
-1.016
-1.99%
jan 1, 1996
48.773
-1.232
-2.46%
jan 1, 1997
48.679
-0.095
-0.19%
jan 1, 1998
46.975
-1.703
-3.5%
jan 1, 1999
46.353
-0.622
-1.32%
jan 1, 2000
46.074
-0.28
-0.6%
jan 1, 2001
43.749
-2.325
-5.05%
jan 1, 2002
41.417
-2.332
-5.33%
jan 1, 2003
37.874
-3.543
-8.55%
jan 1, 2004
34.832
-3.042
-8.03%
jan 1, 2005
31.956
-2.876
-8.26%
jan 1, 2006
29.486
-2.47
-7.73%
jan 1, 2007
26.928
-2.557
-8.67%
jan 1, 2008
25.586
-1.343
-4.99%
jan 1, 2009
23.778
-1.807
-7.06%
jan 1, 2010
22.89
-0.889
-3.74%
jan 1, 2011
23.263
+0.374
1.63%
jan 1, 2012
21.885
-1.378
-5.93%
jan 1, 2013
20.734
-1.151
-5.26%
jan 1, 2014
19.909
-0.825
-3.98%
jan 1, 2015
19.548
-0.361
-1.82%
Ranking of countries by current statistics by years


Comments: