29
/
en
AIzaSyAYiBZKx7MnpbEhh9jyipgxe19OcubqV5w
April 1, 2024
44877
Low & middle income
LMY
false
2
1
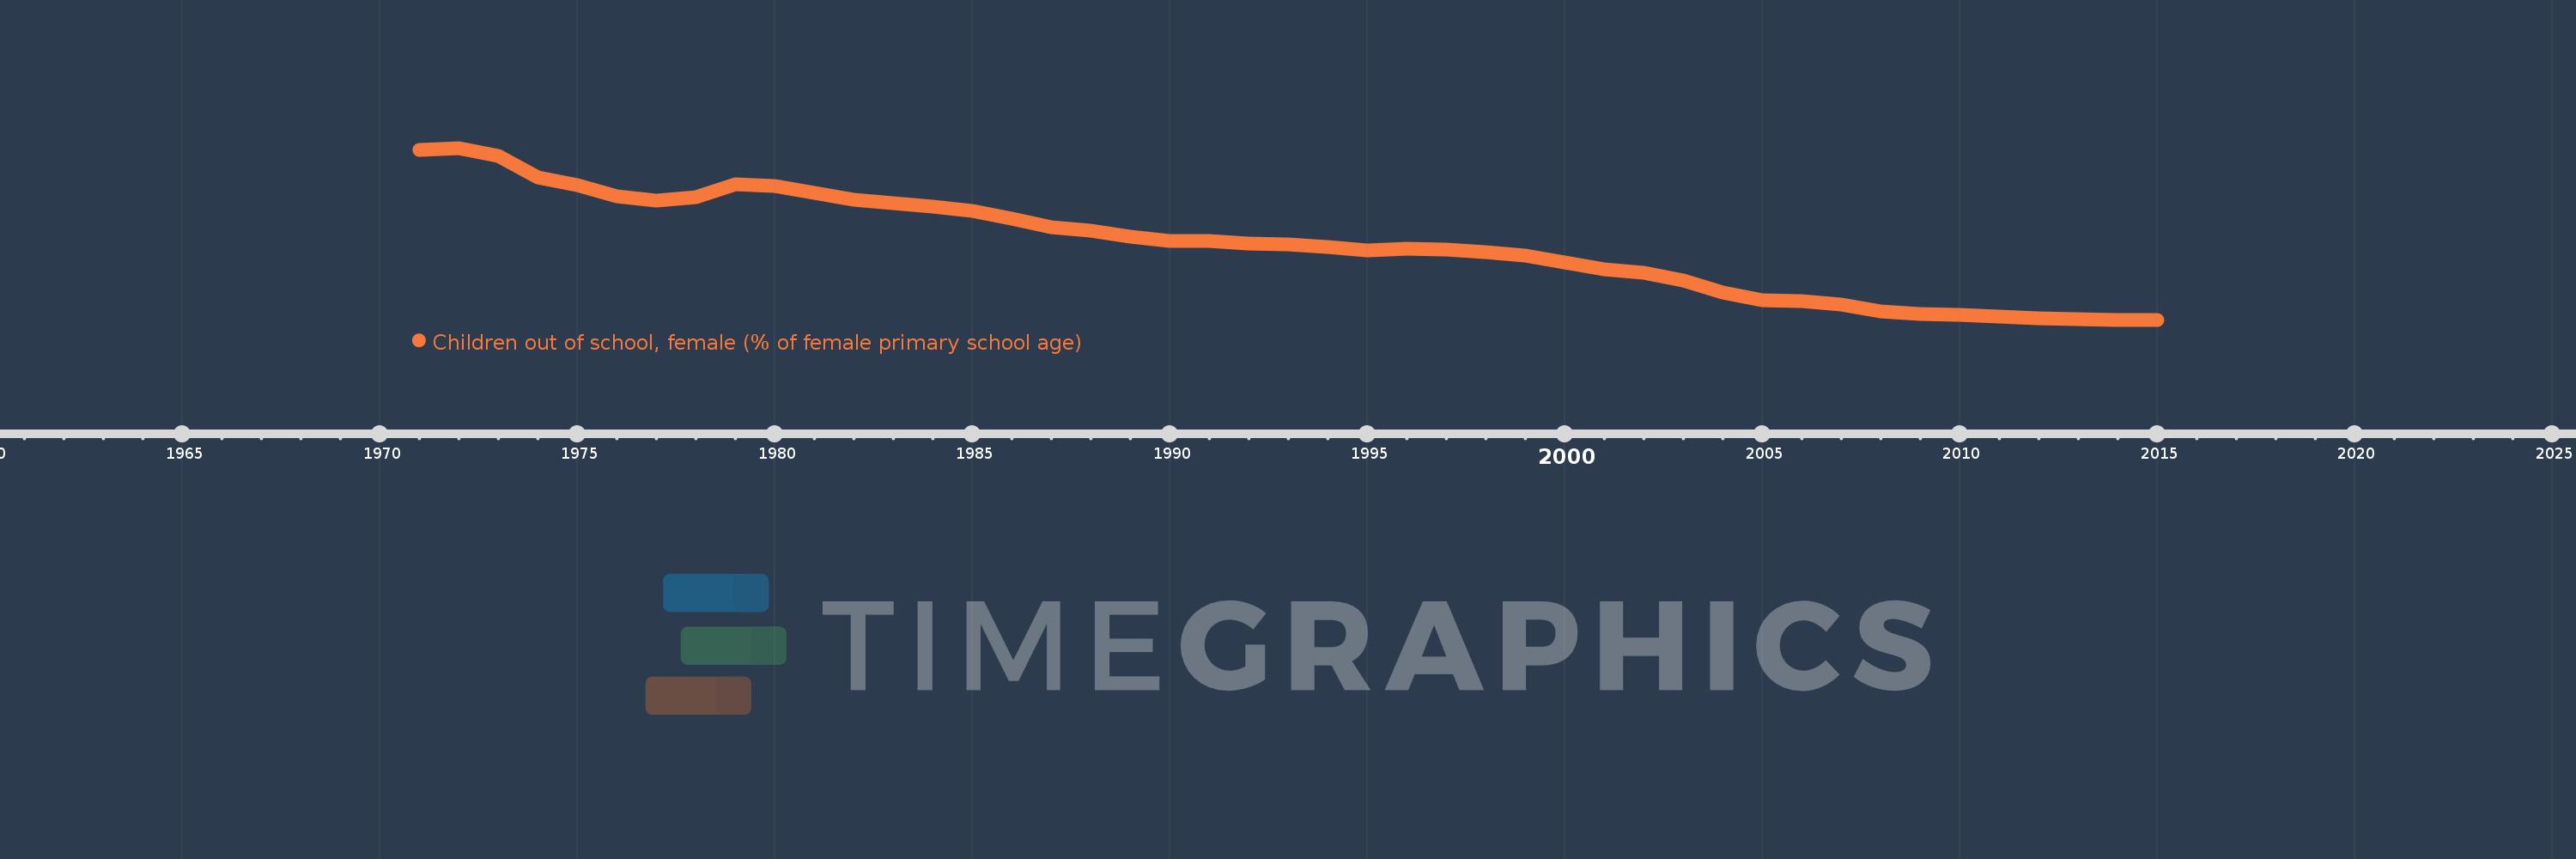
Children out of school, female (% of female primary school age)
2015,2014,2013,2012,2011,2010,2009,2008,2007,2006,2005,2004,2003,2002,2001,2000,1999,1998,1997,1996,1995,1994,1993,1992,1991,1990,1989,1988,1987,1986,1985,1984,1983,1982,1981,1980,1979,1978,1977,1976,1975,1974,1973,1972,1971
This statistics in other country:
AfghanistanAlbaniaAlgeriaAngolaAntigua and BarbudaArab WorldArgentinaArmeniaArubaAustraliaAustriaAzerbaijanBahamas, TheBahrainBangladeshBarbadosBelarusBelgiumBelizeBeninBermudaBhutanBoliviaBosnia and HerzegovinaBotswanaBrazilBrunei DarussalamBulgariaBurkina FasoBurundiCabo VerdeCambodiaCameroonCanadaCaribbean small statesCentral African RepublicCentral Europe and the BalticsChadChileChinaColombiaComorosCongo, Dem. Rep.Congo, Rep.Costa RicaCote d'IvoireCroatiaCubaCyprusDenmarkDjiboutiDominicaDominican RepublicEarly-demographic dividendEast Asia & PacificEast Asia & Pacific (excluding high income)East Asia & Pacific (IDA & IBRD countries)EcuadorEgypt, Arab Rep.El SalvadorEquatorial GuineaEritreaEstoniaEthiopiaEuro areaEurope & Central AsiaEurope & Central Asia (excluding high income)Europe & Central Asia (IDA & IBRD countries)European UnionFijiFinlandFragile and conflict affected situationsFranceGabonGambia, TheGeorgiaGhanaGreeceGrenadaGuatemalaGuineaGuinea-BissauGuyanaHaitiHeavily indebted poor countries (HIPC)High incomeHondurasHong Kong SAR, ChinaHungaryIBRD onlyIcelandIDA & IBRD totalIDA blendIDA onlyIDA totalIndiaIndonesiaIran, Islamic Rep.IraqIrelandIsraelItalyJamaicaJapanJordanKazakhstanKenyaKiribatiKorea, Dem. People’s Rep.Korea, Rep.KuwaitKyrgyz RepublicLao PDRLate-demographic dividendLatin America & Caribbean Latin America & Caribbean (excluding high income)Latin America & the Caribbean (IDA & IBRD countries)LatviaLeast developed countries: UN classificationLebanonLesothoLiberiaLibyaLiechtensteinLithuaniaLow & middle incomeLow incomeLower middle incomeLuxembourgMacao SAR, ChinaMacedonia, FYRMadagascarMalawiMaldivesMaliMaltaMarshall IslandsMauritaniaMauritiusMexicoMicronesia, Fed. Sts.Middle East & North AfricaMiddle East & North Africa (excluding high income)Middle East & North Africa (IDA & IBRD countries)Middle incomeMoldovaMongoliaMontenegroMoroccoMozambiqueMyanmarNamibiaNauruNepalNetherlandsNew ZealandNicaraguaNigerNigeriaNorth AmericaNorwayOECD membersOmanOther small statesPacific island small statesPakistanPanamaPapua New GuineaParaguayPeruPhilippinesPolandPortugalPost-demographic dividendPre-demographic dividendPuerto RicoQatarRomaniaRussian FederationRwandaSamoaSan MarinoSao Tome and PrincipeSaudi ArabiaSenegalSerbiaSeychellesSierra LeoneSloveniaSmall statesSolomon IslandsSomaliaSouth AfricaSouth AsiaSouth Asia (IDA & IBRD)South SudanSpainSri LankaSt. Kitts and NevisSt. LuciaSt. Vincent and the GrenadinesSub-Saharan Africa Sub-Saharan Africa (excluding high income)Sub-Saharan Africa (IDA & IBRD countries)SudanSurinameSwazilandSwedenSwitzerlandSyrian Arab RepublicTajikistanTanzaniaThailandTimor-LesteTogoTongaTrinidad and TobagoTunisiaTurkeyTuvaluUgandaUkraineUnited Arab EmiratesUnited KingdomUnited StatesUpper middle incomeUruguayUzbekistanVanuatuVenezuela, RBWest Bank and GazaWorldYemen, Rep.ZambiaZimbabwe Timeline:
This timeline shows a graph from 1971 to 2015 of Low & middle income. No data until 1970. Number of actual observations by date: 45.
Source name:
World Development Indicators
Source organization:
United Nations Educational, Scientific, and Cultural Organization (UNESCO) Institute for Statistics.
Categories, topics:
Education
Last updated:
apr 23, 2017
Indicators value changes by year
Minimum:
10.459
jan 1, 2015
Maximum:
42.117
jan 1, 1972
At the date of observation
Value
Absolute change
Change from previous value
jan 1, 1971
41.764
+41.764
0.0%
jan 1, 1972
42.117
+0.353
0.85%
jan 1, 1973
40.597
-1.52
-3.61%
jan 1, 1974
36.749
-3.848
-9.48%
jan 1, 1975
35.284
-1.465
-3.99%
jan 1, 1976
33.172
-2.112
-5.99%
jan 1, 1977
32.343
-0.829
-2.5%
jan 1, 1978
33.0
+0.657
2.03%
jan 1, 1979
35.344
+2.344
7.1%
jan 1, 1980
35.12
-0.224
-0.63%
jan 1, 1981
33.845
-1.275
-3.63%
jan 1, 1982
32.578
-1.267
-3.74%
jan 1, 1983
31.931
-0.647
-1.99%
jan 1, 1984
31.324
-0.607
-1.9%
jan 1, 1985
30.568
-0.756
-2.41%
jan 1, 1986
29.115
-1.453
-4.75%
jan 1, 1987
27.526
-1.589
-5.46%
jan 1, 1988
26.855
-0.671
-2.44%
jan 1, 1989
25.694
-1.161
-4.32%
jan 1, 1990
24.957
-0.736
-2.87%
jan 1, 1991
25.048
+0.09
0.36%
jan 1, 1992
24.473
-0.574
-2.29%
jan 1, 1993
24.36
-0.113
-0.46%
jan 1, 1994
23.8
-0.56
-2.3%
jan 1, 1995
23.304
-0.496
-2.08%
jan 1, 1996
23.488
+0.184
0.79%
jan 1, 1997
23.433
-0.055
-0.23%
jan 1, 1998
22.976
-0.458
-1.95%
jan 1, 1999
22.208
-0.768
-3.34%
jan 1, 2000
21.015
-1.193
-5.37%
jan 1, 2001
19.813
-1.202
-5.72%
jan 1, 2002
19.122
-0.691
-3.49%
jan 1, 2003
17.768
-1.354
-7.08%
jan 1, 2004
15.429
-2.339
-13.17%
jan 1, 2005
14.015
-1.414
-9.16%
jan 1, 2006
13.848
-0.167
-1.19%
jan 1, 2007
13.236
-0.611
-4.41%
jan 1, 2008
12.0
-1.236
-9.34%
jan 1, 2009
11.499
-0.501
-4.18%
jan 1, 2010
11.308
-0.191
-1.66%
jan 1, 2011
11.083
-0.226
-1.99%
jan 1, 2012
10.774
-0.309
-2.79%
jan 1, 2013
10.547
-0.227
-2.11%
jan 1, 2014
10.485
-0.062
-0.59%
jan 1, 2015
10.459
-0.026
-0.25%
Ranking of countries by current statistics by years


Comments: