29
/
en
AIzaSyAYiBZKx7MnpbEhh9jyipgxe19OcubqV5w
April 1, 2024
24719
Caribbean small states
CSS
false
2
1
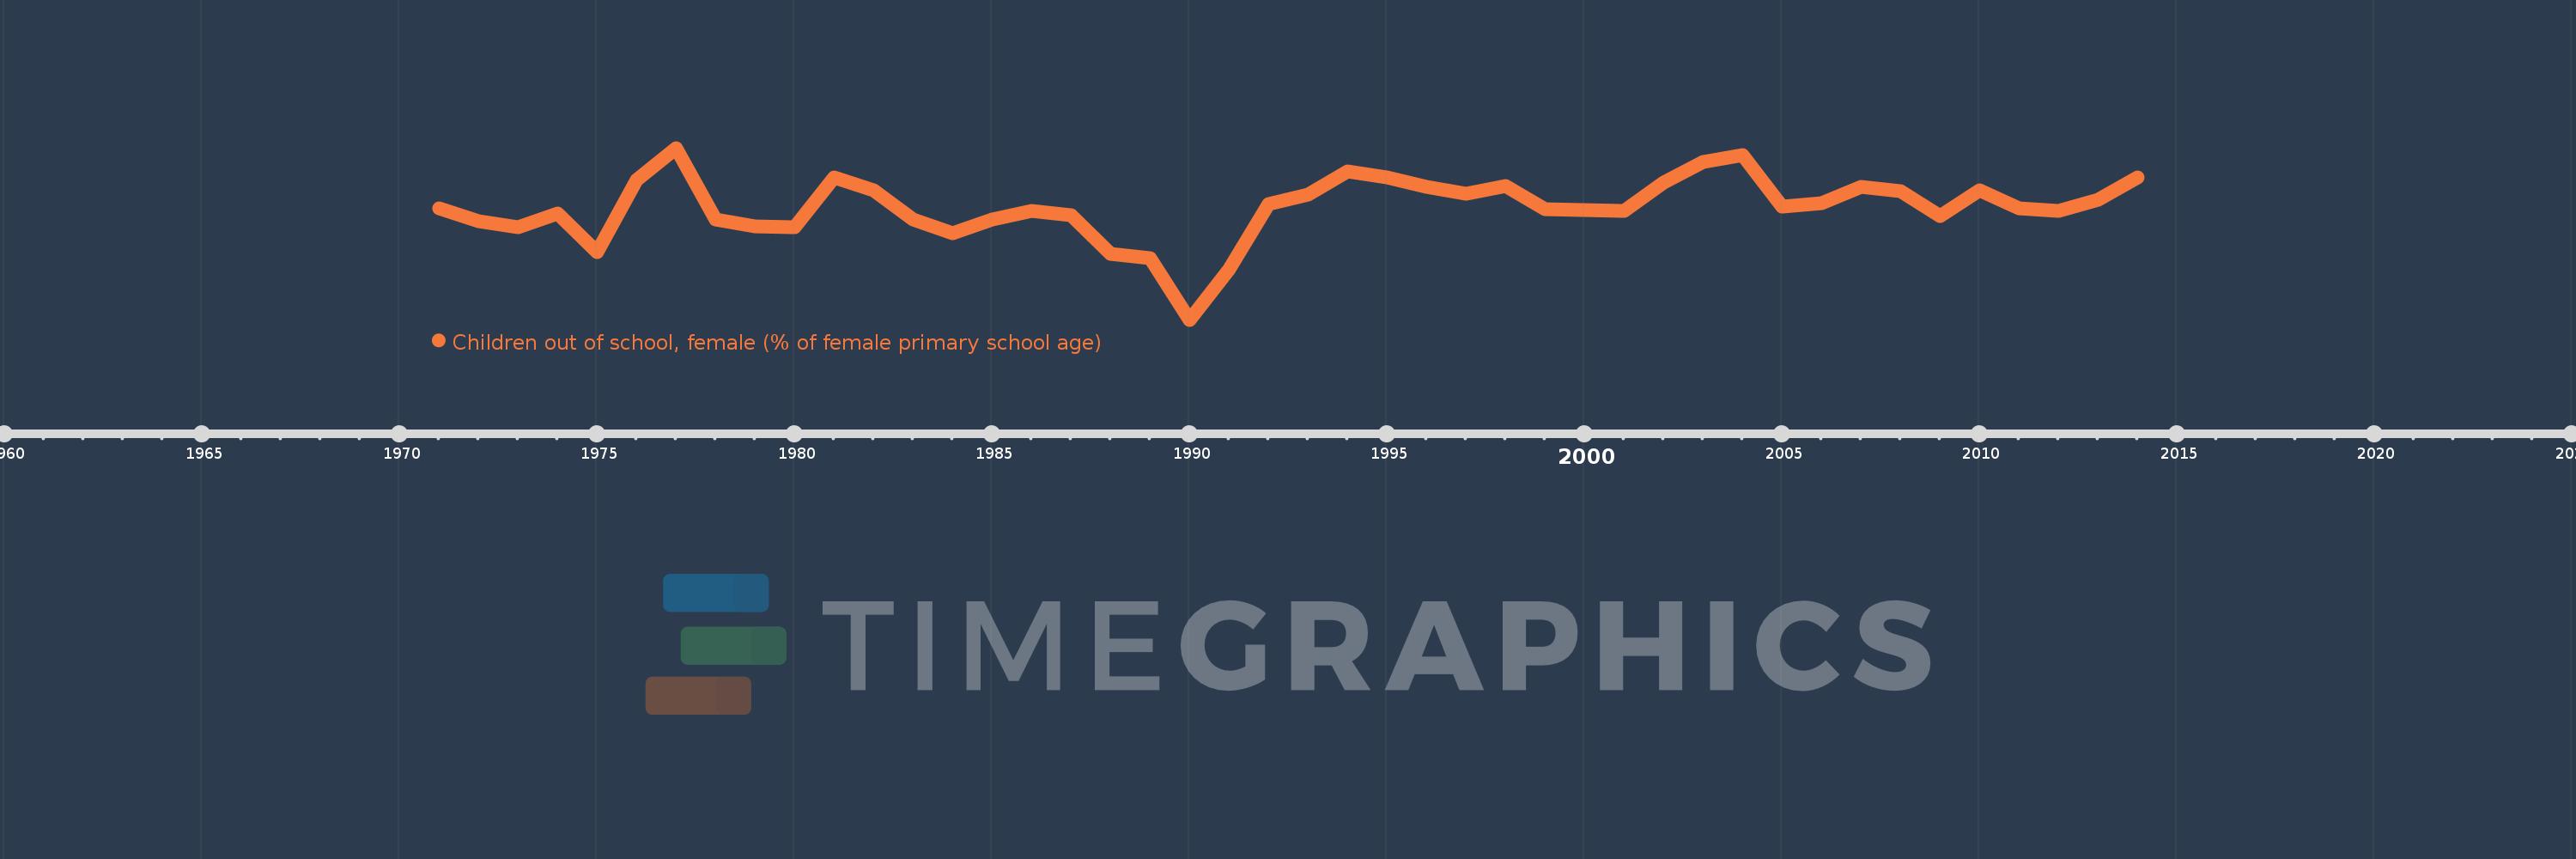
Children out of school, female (% of female primary school age)
2014,2013,2012,2011,2010,2009,2008,2007,2006,2005,2004,2003,2002,2001,2000,1999,1998,1997,1996,1995,1994,1993,1992,1991,1990,1989,1988,1987,1986,1985,1984,1983,1982,1981,1980,1979,1978,1977,1976,1975,1974,1973,1972,1971
This statistics in other country:
AfghanistanAlbaniaAlgeriaAngolaAntigua and BarbudaArab WorldArgentinaArmeniaArubaAustraliaAustriaAzerbaijanBahamas, TheBahrainBangladeshBarbadosBelarusBelgiumBelizeBeninBermudaBhutanBoliviaBosnia and HerzegovinaBotswanaBrazilBrunei DarussalamBulgariaBurkina FasoBurundiCabo VerdeCambodiaCameroonCanadaCaribbean small statesCentral African RepublicCentral Europe and the BalticsChadChileChinaColombiaComorosCongo, Dem. Rep.Congo, Rep.Costa RicaCote d'IvoireCroatiaCubaCyprusDenmarkDjiboutiDominicaDominican RepublicEarly-demographic dividendEast Asia & PacificEast Asia & Pacific (excluding high income)East Asia & Pacific (IDA & IBRD countries)EcuadorEgypt, Arab Rep.El SalvadorEquatorial GuineaEritreaEstoniaEthiopiaEuro areaEurope & Central AsiaEurope & Central Asia (excluding high income)Europe & Central Asia (IDA & IBRD countries)European UnionFijiFinlandFragile and conflict affected situationsFranceGabonGambia, TheGeorgiaGhanaGreeceGrenadaGuatemalaGuineaGuinea-BissauGuyanaHaitiHeavily indebted poor countries (HIPC)High incomeHondurasHong Kong SAR, ChinaHungaryIBRD onlyIcelandIDA & IBRD totalIDA blendIDA onlyIDA totalIndiaIndonesiaIran, Islamic Rep.IraqIrelandIsraelItalyJamaicaJapanJordanKazakhstanKenyaKiribatiKorea, Dem. People’s Rep.Korea, Rep.KuwaitKyrgyz RepublicLao PDRLate-demographic dividendLatin America & Caribbean Latin America & Caribbean (excluding high income)Latin America & the Caribbean (IDA & IBRD countries)LatviaLeast developed countries: UN classificationLebanonLesothoLiberiaLibyaLiechtensteinLithuaniaLow & middle incomeLow incomeLower middle incomeLuxembourgMacao SAR, ChinaMacedonia, FYRMadagascarMalawiMaldivesMaliMaltaMarshall IslandsMauritaniaMauritiusMexicoMicronesia, Fed. Sts.Middle East & North AfricaMiddle East & North Africa (excluding high income)Middle East & North Africa (IDA & IBRD countries)Middle incomeMoldovaMongoliaMontenegroMoroccoMozambiqueMyanmarNamibiaNauruNepalNetherlandsNew ZealandNicaraguaNigerNigeriaNorth AmericaNorwayOECD membersOmanOther small statesPacific island small statesPakistanPanamaPapua New GuineaParaguayPeruPhilippinesPolandPortugalPost-demographic dividendPre-demographic dividendPuerto RicoQatarRomaniaRussian FederationRwandaSamoaSan MarinoSao Tome and PrincipeSaudi ArabiaSenegalSerbiaSeychellesSierra LeoneSloveniaSmall statesSolomon IslandsSomaliaSouth AfricaSouth AsiaSouth Asia (IDA & IBRD)South SudanSpainSri LankaSt. Kitts and NevisSt. LuciaSt. Vincent and the GrenadinesSub-Saharan Africa Sub-Saharan Africa (excluding high income)Sub-Saharan Africa (IDA & IBRD countries)SudanSurinameSwazilandSwedenSwitzerlandSyrian Arab RepublicTajikistanTanzaniaThailandTimor-LesteTogoTongaTrinidad and TobagoTunisiaTurkeyTuvaluUgandaUkraineUnited Arab EmiratesUnited KingdomUnited StatesUpper middle incomeUruguayUzbekistanVanuatuVenezuela, RBWest Bank and GazaWorldYemen, Rep.ZambiaZimbabwe Timeline:
This timeline shows a graph from 1971 to 2014 of Caribbean small states. No data until 1970. Number of actual observations by date: 44.
Source name:
World Development Indicators
Source organization:
United Nations Educational, Scientific, and Cultural Organization (UNESCO) Institute for Statistics.
Categories, topics:
Education
Last updated:
apr 23, 2017
Indicators value changes by year
At the date of observation
Value
Absolute change
Change from previous value
jan 1, 1971
6.321
+6.321
0.0%
jan 1, 1972
5.928
-0.394
-6.23%
jan 1, 1973
5.727
-0.201
-3.39%
jan 1, 1974
6.171
+0.444
7.75%
jan 1, 1975
4.973
-1.198
-19.42%
jan 1, 1976
7.212
+2.239
45.03%
jan 1, 1977
8.192
+0.98
13.59%
jan 1, 1978
5.987
-2.205
-26.92%
jan 1, 1979
5.769
-0.218
-3.64%
jan 1, 1980
5.75
-0.019
-0.33%
jan 1, 1981
7.268
+1.518
26.39%
jan 1, 1982
6.884
-0.384
-5.28%
jan 1, 1983
5.964
-0.92
-13.36%
jan 1, 1984
5.562
-0.403
-6.75%
jan 1, 1985
5.98
+0.418
7.52%
jan 1, 1986
6.238
+0.257
4.3%
jan 1, 1987
6.114
-0.124
-1.99%
jan 1, 1988
4.918
-1.196
-19.57%
jan 1, 1989
4.788
-0.13
-2.65%
jan 1, 1990
2.874
-1.913
-39.97%
jan 1, 1991
4.439
+1.565
54.44%
jan 1, 1992
6.443
+2.004
45.15%
jan 1, 1993
6.738
+0.295
4.57%
jan 1, 1994
7.472
+0.734
10.9%
jan 1, 1995
7.28
-0.192
-2.57%
jan 1, 1996
6.996
-0.284
-3.91%
jan 1, 1997
6.774
-0.222
-3.17%
jan 1, 1998
7.017
+0.243
3.59%
jan 1, 1999
6.293
-0.725
-10.33%
jan 1, 2000
6.266
-0.027
-0.42%
jan 1, 2001
6.241
-0.025
-0.4%
jan 1, 2002
7.13
+0.889
14.25%
jan 1, 2003
7.747
+0.617
8.65%
jan 1, 2004
7.972
+0.225
2.91%
jan 1, 2005
6.389
-1.584
-19.87%
jan 1, 2006
6.482
+0.094
1.47%
jan 1, 2007
6.978
+0.496
7.65%
jan 1, 2008
6.856
-0.122
-1.75%
jan 1, 2009
6.086
-0.77
-11.23%
jan 1, 2010
6.88
+0.793
13.03%
jan 1, 2011
6.32
-0.559
-8.13%
jan 1, 2012
6.247
-0.073
-1.16%
jan 1, 2013
6.592
+0.345
5.53%
jan 1, 2014
7.275
+0.683
10.36%
Ranking of countries by current statistics by years


Comments: