29
/
en
AIzaSyAYiBZKx7MnpbEhh9jyipgxe19OcubqV5w
April 1, 2024
115627
Cuba
CUB
true
2
1
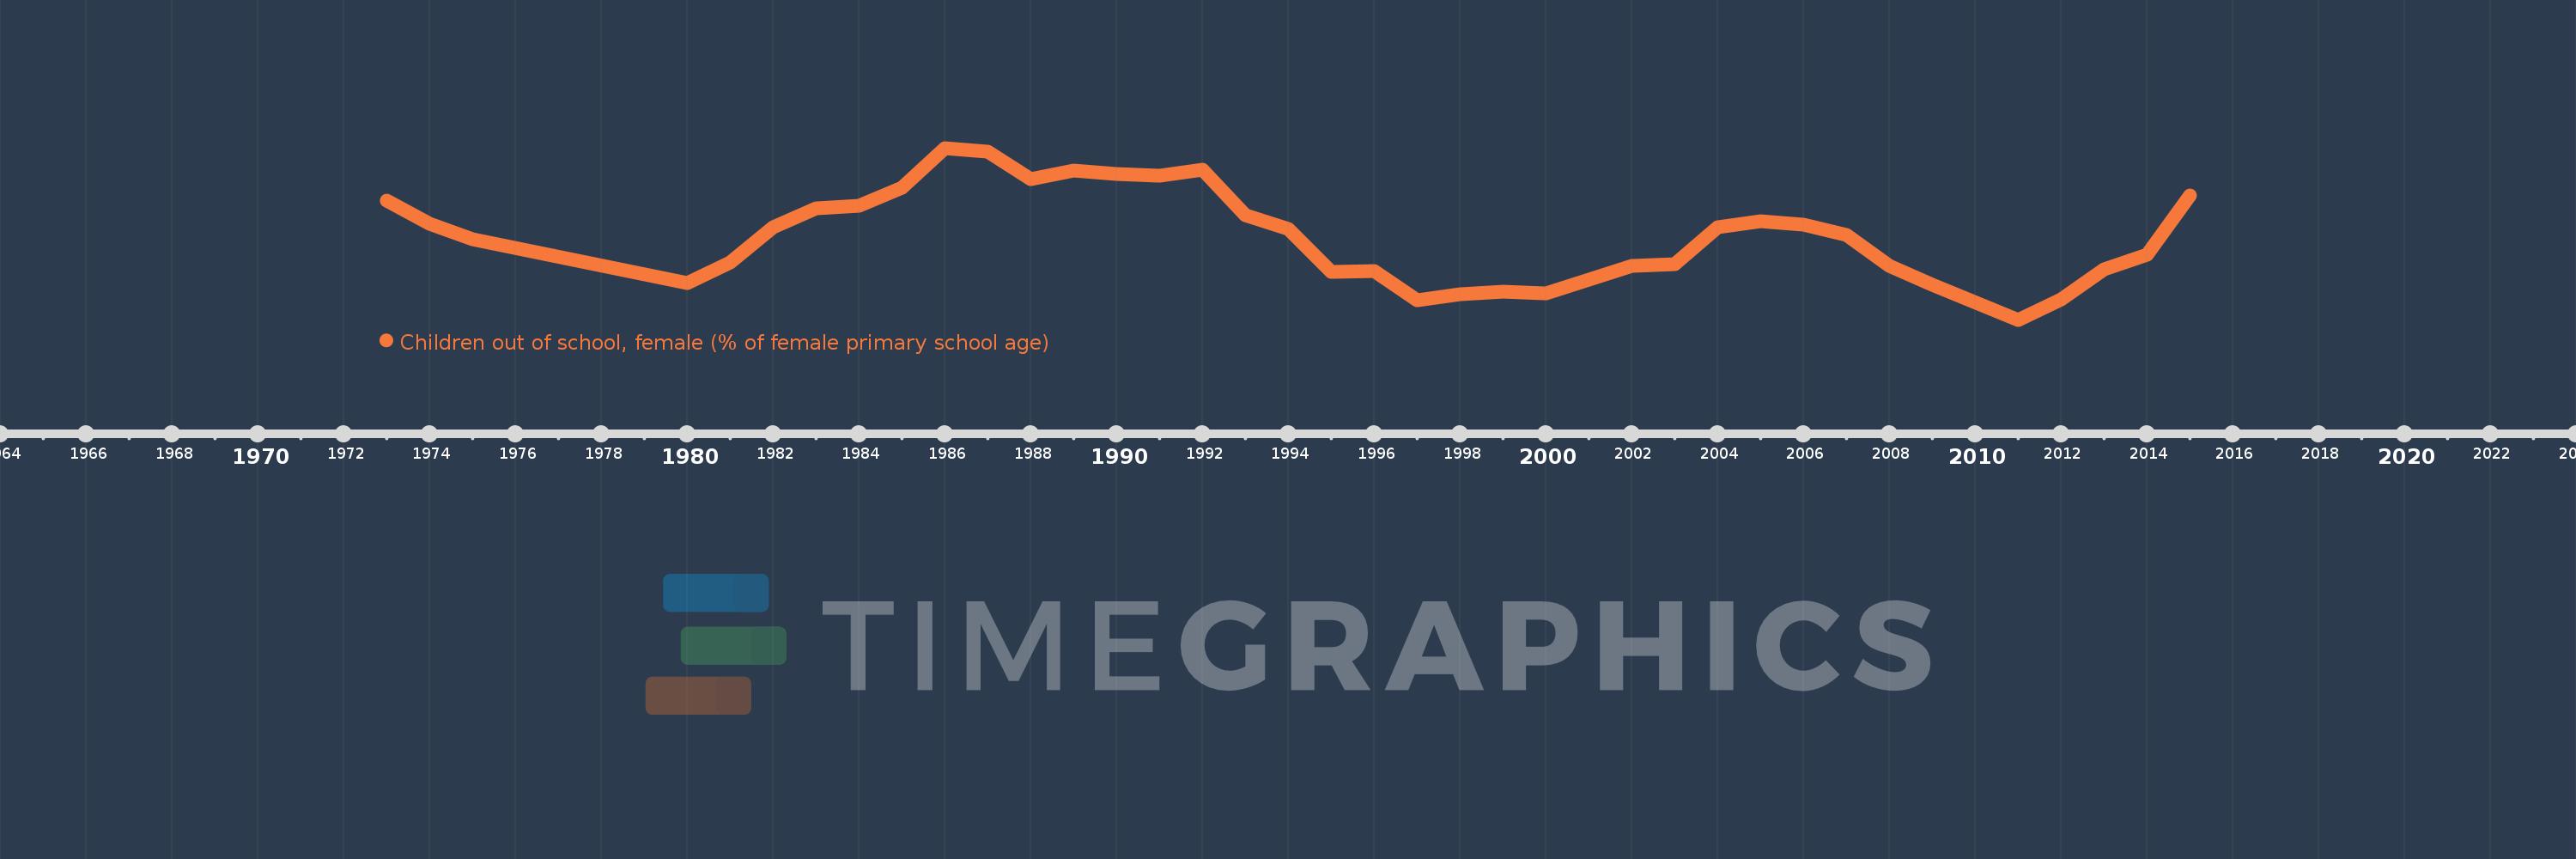
Children out of school, female (% of female primary school age)
2015,2014,2013,2012,2011,2009,2008,2007,2006,2005,2004,2003,2002,2001,2000,1999,1998,1997,1996,1995,1994,1993,1992,1991,1990,1989,1988,1987,1986,1985,1984,1983,1982,1981,1980,1975,1974,1973
This statistics in other country:
AfghanistanAlbaniaAlgeriaAngolaAntigua and BarbudaArab WorldArgentinaArmeniaArubaAustraliaAustriaAzerbaijanBahamas, TheBahrainBangladeshBarbadosBelarusBelgiumBelizeBeninBermudaBhutanBoliviaBosnia and HerzegovinaBotswanaBrazilBrunei DarussalamBulgariaBurkina FasoBurundiCabo VerdeCambodiaCameroonCanadaCaribbean small statesCentral African RepublicCentral Europe and the BalticsChadChileChinaColombiaComorosCongo, Dem. Rep.Congo, Rep.Costa RicaCote d'IvoireCroatiaCubaCyprusDenmarkDjiboutiDominicaDominican RepublicEarly-demographic dividendEast Asia & PacificEast Asia & Pacific (excluding high income)East Asia & Pacific (IDA & IBRD countries)EcuadorEgypt, Arab Rep.El SalvadorEquatorial GuineaEritreaEstoniaEthiopiaEuro areaEurope & Central AsiaEurope & Central Asia (excluding high income)Europe & Central Asia (IDA & IBRD countries)European UnionFijiFinlandFragile and conflict affected situationsFranceGabonGambia, TheGeorgiaGhanaGreeceGrenadaGuatemalaGuineaGuinea-BissauGuyanaHaitiHeavily indebted poor countries (HIPC)High incomeHondurasHong Kong SAR, ChinaHungaryIBRD onlyIcelandIDA & IBRD totalIDA blendIDA onlyIDA totalIndiaIndonesiaIran, Islamic Rep.IraqIrelandIsraelItalyJamaicaJapanJordanKazakhstanKenyaKiribatiKorea, Dem. People’s Rep.Korea, Rep.KuwaitKyrgyz RepublicLao PDRLate-demographic dividendLatin America & Caribbean Latin America & Caribbean (excluding high income)Latin America & the Caribbean (IDA & IBRD countries)LatviaLeast developed countries: UN classificationLebanonLesothoLiberiaLibyaLiechtensteinLithuaniaLow & middle incomeLow incomeLower middle incomeLuxembourgMacao SAR, ChinaMacedonia, FYRMadagascarMalawiMaldivesMaliMaltaMarshall IslandsMauritaniaMauritiusMexicoMicronesia, Fed. Sts.Middle East & North AfricaMiddle East & North Africa (excluding high income)Middle East & North Africa (IDA & IBRD countries)Middle incomeMoldovaMongoliaMontenegroMoroccoMozambiqueMyanmarNamibiaNauruNepalNetherlandsNew ZealandNicaraguaNigerNigeriaNorth AmericaNorwayOECD membersOmanOther small statesPacific island small statesPakistanPanamaPapua New GuineaParaguayPeruPhilippinesPolandPortugalPost-demographic dividendPre-demographic dividendPuerto RicoQatarRomaniaRussian FederationRwandaSamoaSan MarinoSao Tome and PrincipeSaudi ArabiaSenegalSerbiaSeychellesSierra LeoneSloveniaSmall statesSolomon IslandsSomaliaSouth AfricaSouth AsiaSouth Asia (IDA & IBRD)South SudanSpainSri LankaSt. Kitts and NevisSt. LuciaSt. Vincent and the GrenadinesSub-Saharan Africa Sub-Saharan Africa (excluding high income)Sub-Saharan Africa (IDA & IBRD countries)SudanSurinameSwazilandSwedenSwitzerlandSyrian Arab RepublicTajikistanTanzaniaThailandTimor-LesteTogoTongaTrinidad and TobagoTunisiaTurkeyTuvaluUgandaUkraineUnited Arab EmiratesUnited KingdomUnited StatesUpper middle incomeUruguayUzbekistanVanuatuVenezuela, RBWest Bank and GazaWorldYemen, Rep.ZambiaZimbabwe Timeline:
This timeline shows a graph from 1973 to 2015 of Cuba. No data until 1972. Number of actual observations by date: 38.
Source name:
World Development Indicators
Source organization:
United Nations Educational, Scientific, and Cultural Organization (UNESCO) Institute for Statistics.
Categories, topics:
Education
Last updated:
apr 23, 2017
Indicators value changes by year
At the date of observation
Value
Absolute change
Change from previous value
jan 1, 1973
6.213
+6.213
0.0%
jan 1, 1974
4.998
-1.215
-19.56%
jan 1, 1975
4.198
-0.8
-16.01%
jan 1, 1980
1.929
-2.269
-54.06%
jan 1, 1981
3.005
+1.077
55.85%
jan 1, 1982
4.804
+1.799
59.84%
jan 1, 1983
5.813
+1.009
21.01%
jan 1, 1984
5.933
+0.119
2.05%
jan 1, 1985
6.868
+0.936
15.77%
jan 1, 1986
8.945
+2.077
30.23%
jan 1, 1987
8.736
-0.209
-2.34%
jan 1, 1988
7.324
-1.411
-16.16%
jan 1, 1989
7.778
+0.454
6.19%
jan 1, 1990
7.581
-0.197
-2.53%
jan 1, 1991
7.497
-0.084
-1.11%
jan 1, 1992
7.809
+0.311
4.15%
jan 1, 1993
5.429
-2.379
-30.47%
jan 1, 1994
4.711
-0.719
-13.24%
jan 1, 1995
2.482
-2.229
-47.32%
jan 1, 1996
2.517
+0.036
1.45%
jan 1, 1997
1.04
-1.478
-58.7%
jan 1, 1998
1.345
+0.305
29.32%
jan 1, 1999
1.481
+0.136
10.13%
jan 1, 2000
1.397
-0.084
-5.65%
jan 1, 2001
2.083
+0.686
49.09%
jan 1, 2002
2.8
+0.717
34.43%
jan 1, 2003
2.886
+0.086
3.07%
jan 1, 2004
4.809
+1.922
66.61%
jan 1, 2005
5.12
+0.311
6.48%
jan 1, 2006
4.939
-0.182
-3.55%
jan 1, 2007
4.395
-0.544
-11.01%
jan 1, 2008
2.791
-1.603
-36.48%
jan 1, 2009
1.831
-0.961
-34.42%
jan 1, 2011
0.003
-1.827
-99.82%
jan 1, 2012
1.058
+1.055
32.76K%
jan 1, 2013
2.616
+1.558
147.28%
jan 1, 2014
3.372
+0.756
28.89%
jan 1, 2015
6.483
+3.111
92.27%
Ranking of countries by current statistics by years


Comments: