29
/
en
AIzaSyAYiBZKx7MnpbEhh9jyipgxe19OcubqV5w
April 1, 2024
33273
European Union
EUU
false
2
1
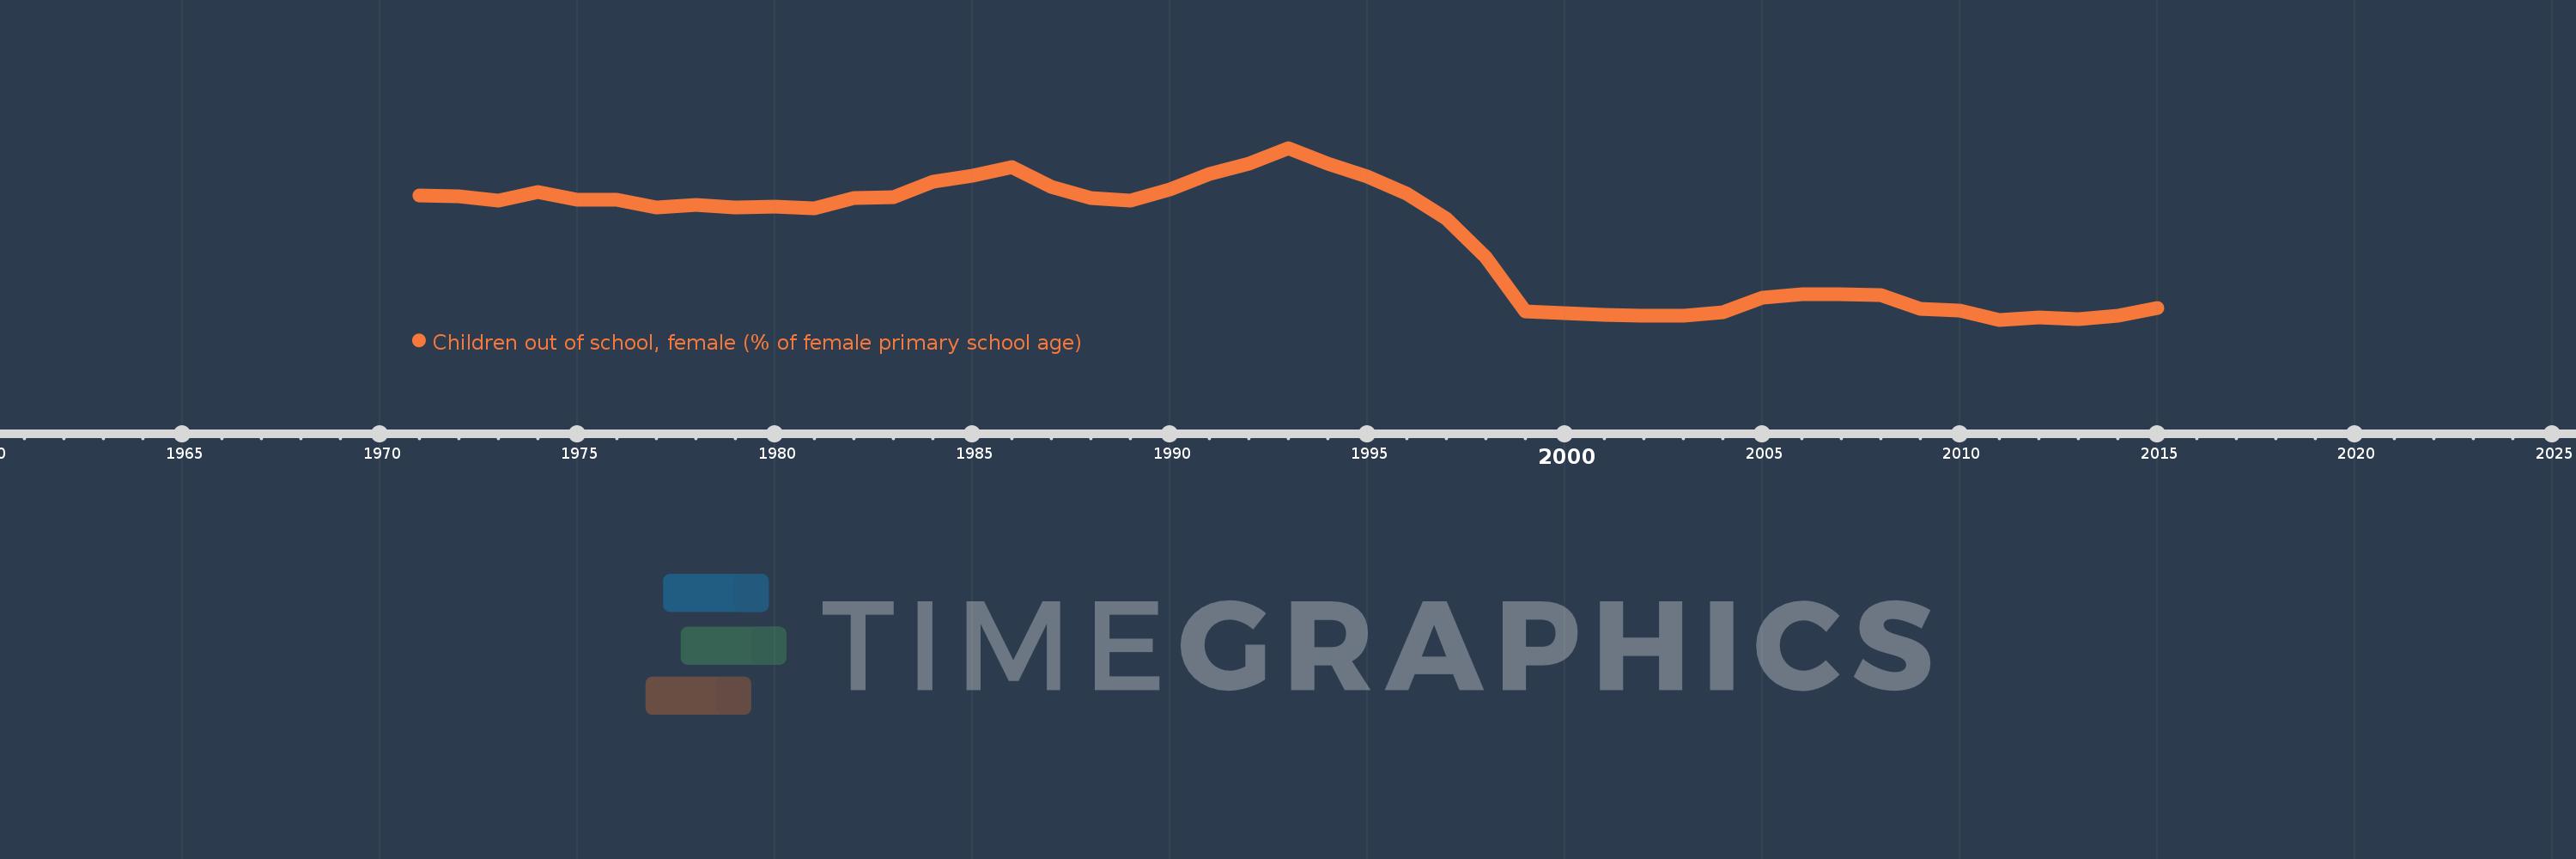
Children out of school, female (% of female primary school age)
2015,2014,2013,2012,2011,2010,2009,2008,2007,2006,2005,2004,2003,2002,2001,2000,1999,1998,1997,1996,1995,1994,1993,1992,1991,1990,1989,1988,1987,1986,1985,1984,1983,1982,1981,1980,1979,1978,1977,1976,1975,1974,1973,1972,1971
This statistics in other country:
AfghanistanAlbaniaAlgeriaAngolaAntigua and BarbudaArab WorldArgentinaArmeniaArubaAustraliaAustriaAzerbaijanBahamas, TheBahrainBangladeshBarbadosBelarusBelgiumBelizeBeninBermudaBhutanBoliviaBosnia and HerzegovinaBotswanaBrazilBrunei DarussalamBulgariaBurkina FasoBurundiCabo VerdeCambodiaCameroonCanadaCaribbean small statesCentral African RepublicCentral Europe and the BalticsChadChileChinaColombiaComorosCongo, Dem. Rep.Congo, Rep.Costa RicaCote d'IvoireCroatiaCubaCyprusDenmarkDjiboutiDominicaDominican RepublicEarly-demographic dividendEast Asia & PacificEast Asia & Pacific (excluding high income)East Asia & Pacific (IDA & IBRD countries)EcuadorEgypt, Arab Rep.El SalvadorEquatorial GuineaEritreaEstoniaEthiopiaEuro areaEurope & Central AsiaEurope & Central Asia (excluding high income)Europe & Central Asia (IDA & IBRD countries)European UnionFijiFinlandFragile and conflict affected situationsFranceGabonGambia, TheGeorgiaGhanaGreeceGrenadaGuatemalaGuineaGuinea-BissauGuyanaHaitiHeavily indebted poor countries (HIPC)High incomeHondurasHong Kong SAR, ChinaHungaryIBRD onlyIcelandIDA & IBRD totalIDA blendIDA onlyIDA totalIndiaIndonesiaIran, Islamic Rep.IraqIrelandIsraelItalyJamaicaJapanJordanKazakhstanKenyaKiribatiKorea, Dem. People’s Rep.Korea, Rep.KuwaitKyrgyz RepublicLao PDRLate-demographic dividendLatin America & Caribbean Latin America & Caribbean (excluding high income)Latin America & the Caribbean (IDA & IBRD countries)LatviaLeast developed countries: UN classificationLebanonLesothoLiberiaLibyaLiechtensteinLithuaniaLow & middle incomeLow incomeLower middle incomeLuxembourgMacao SAR, ChinaMacedonia, FYRMadagascarMalawiMaldivesMaliMaltaMarshall IslandsMauritaniaMauritiusMexicoMicronesia, Fed. Sts.Middle East & North AfricaMiddle East & North Africa (excluding high income)Middle East & North Africa (IDA & IBRD countries)Middle incomeMoldovaMongoliaMontenegroMoroccoMozambiqueMyanmarNamibiaNauruNepalNetherlandsNew ZealandNicaraguaNigerNigeriaNorth AmericaNorwayOECD membersOmanOther small statesPacific island small statesPakistanPanamaPapua New GuineaParaguayPeruPhilippinesPolandPortugalPost-demographic dividendPre-demographic dividendPuerto RicoQatarRomaniaRussian FederationRwandaSamoaSan MarinoSao Tome and PrincipeSaudi ArabiaSenegalSerbiaSeychellesSierra LeoneSloveniaSmall statesSolomon IslandsSomaliaSouth AfricaSouth AsiaSouth Asia (IDA & IBRD)South SudanSpainSri LankaSt. Kitts and NevisSt. LuciaSt. Vincent and the GrenadinesSub-Saharan Africa Sub-Saharan Africa (excluding high income)Sub-Saharan Africa (IDA & IBRD countries)SudanSurinameSwazilandSwedenSwitzerlandSyrian Arab RepublicTajikistanTanzaniaThailandTimor-LesteTogoTongaTrinidad and TobagoTunisiaTurkeyTuvaluUgandaUkraineUnited Arab EmiratesUnited KingdomUnited StatesUpper middle incomeUruguayUzbekistanVanuatuVenezuela, RBWest Bank and GazaWorldYemen, Rep.ZambiaZimbabwe Timeline:
This timeline shows a graph from 1971 to 2015 of European Union. No data until 1970. Number of actual observations by date: 45.
Source name:
World Development Indicators
Source organization:
United Nations Educational, Scientific, and Cultural Organization (UNESCO) Institute for Statistics.
Categories, topics:
Education
Last updated:
apr 23, 2017
Indicators value changes by year
At the date of observation
Value
Absolute change
Change from previous value
jan 1, 1971
4.065
+4.065
0.0%
jan 1, 1972
4.05
-0.015
-0.37%
jan 1, 1973
3.945
-0.104
-2.58%
jan 1, 1974
4.149
+0.204
5.17%
jan 1, 1975
3.957
-0.192
-4.63%
jan 1, 1976
3.956
-0.002
-0.05%
jan 1, 1977
3.787
-0.168
-4.25%
jan 1, 1978
3.854
+0.067
1.76%
jan 1, 1979
3.797
-0.057
-1.47%
jan 1, 1980
3.802
+0.005
0.13%
jan 1, 1981
3.778
-0.024
-0.63%
jan 1, 1982
4.007
+0.229
6.05%
jan 1, 1983
4.018
+0.011
0.28%
jan 1, 1984
4.385
+0.367
9.12%
jan 1, 1985
4.511
+0.126
2.88%
jan 1, 1986
4.701
+0.19
4.22%
jan 1, 1987
4.266
-0.435
-9.26%
jan 1, 1988
4.004
-0.262
-6.15%
jan 1, 1989
3.94
-0.064
-1.6%
jan 1, 1990
4.207
+0.268
6.79%
jan 1, 1991
4.555
+0.347
8.25%
jan 1, 1992
4.778
+0.223
4.9%
jan 1, 1993
5.144
+0.366
7.66%
jan 1, 1994
4.793
-0.35
-6.81%
jan 1, 1995
4.501
-0.292
-6.09%
jan 1, 1996
4.102
-0.399
-8.87%
jan 1, 1997
3.533
-0.57
-13.89%
jan 1, 1998
2.662
-0.87
-24.64%
jan 1, 1999
1.416
-1.246
-46.79%
jan 1, 2000
1.394
-0.023
-1.59%
jan 1, 2001
1.346
-0.048
-3.41%
jan 1, 2002
1.324
-0.022
-1.67%
jan 1, 2003
1.332
+0.008
0.62%
jan 1, 2004
1.408
+0.076
5.68%
jan 1, 2005
1.729
+0.321
22.8%
jan 1, 2006
1.81
+0.082
4.72%
jan 1, 2007
1.824
+0.014
0.77%
jan 1, 2008
1.799
-0.025
-1.37%
jan 1, 2009
1.489
-0.311
-17.26%
jan 1, 2010
1.448
-0.041
-2.76%
jan 1, 2011
1.235
-0.213
-14.69%
jan 1, 2012
1.297
+0.062
5.04%
jan 1, 2013
1.242
-0.055
-4.28%
jan 1, 2014
1.334
+0.092
7.43%
jan 1, 2015
1.51
+0.176
13.22%
Ranking of countries by current statistics by years


Comments: