29
/
en
AIzaSyAYiBZKx7MnpbEhh9jyipgxe19OcubqV5w
April 1, 2024
55362
Pre-demographic dividend
PRE
false
2
1
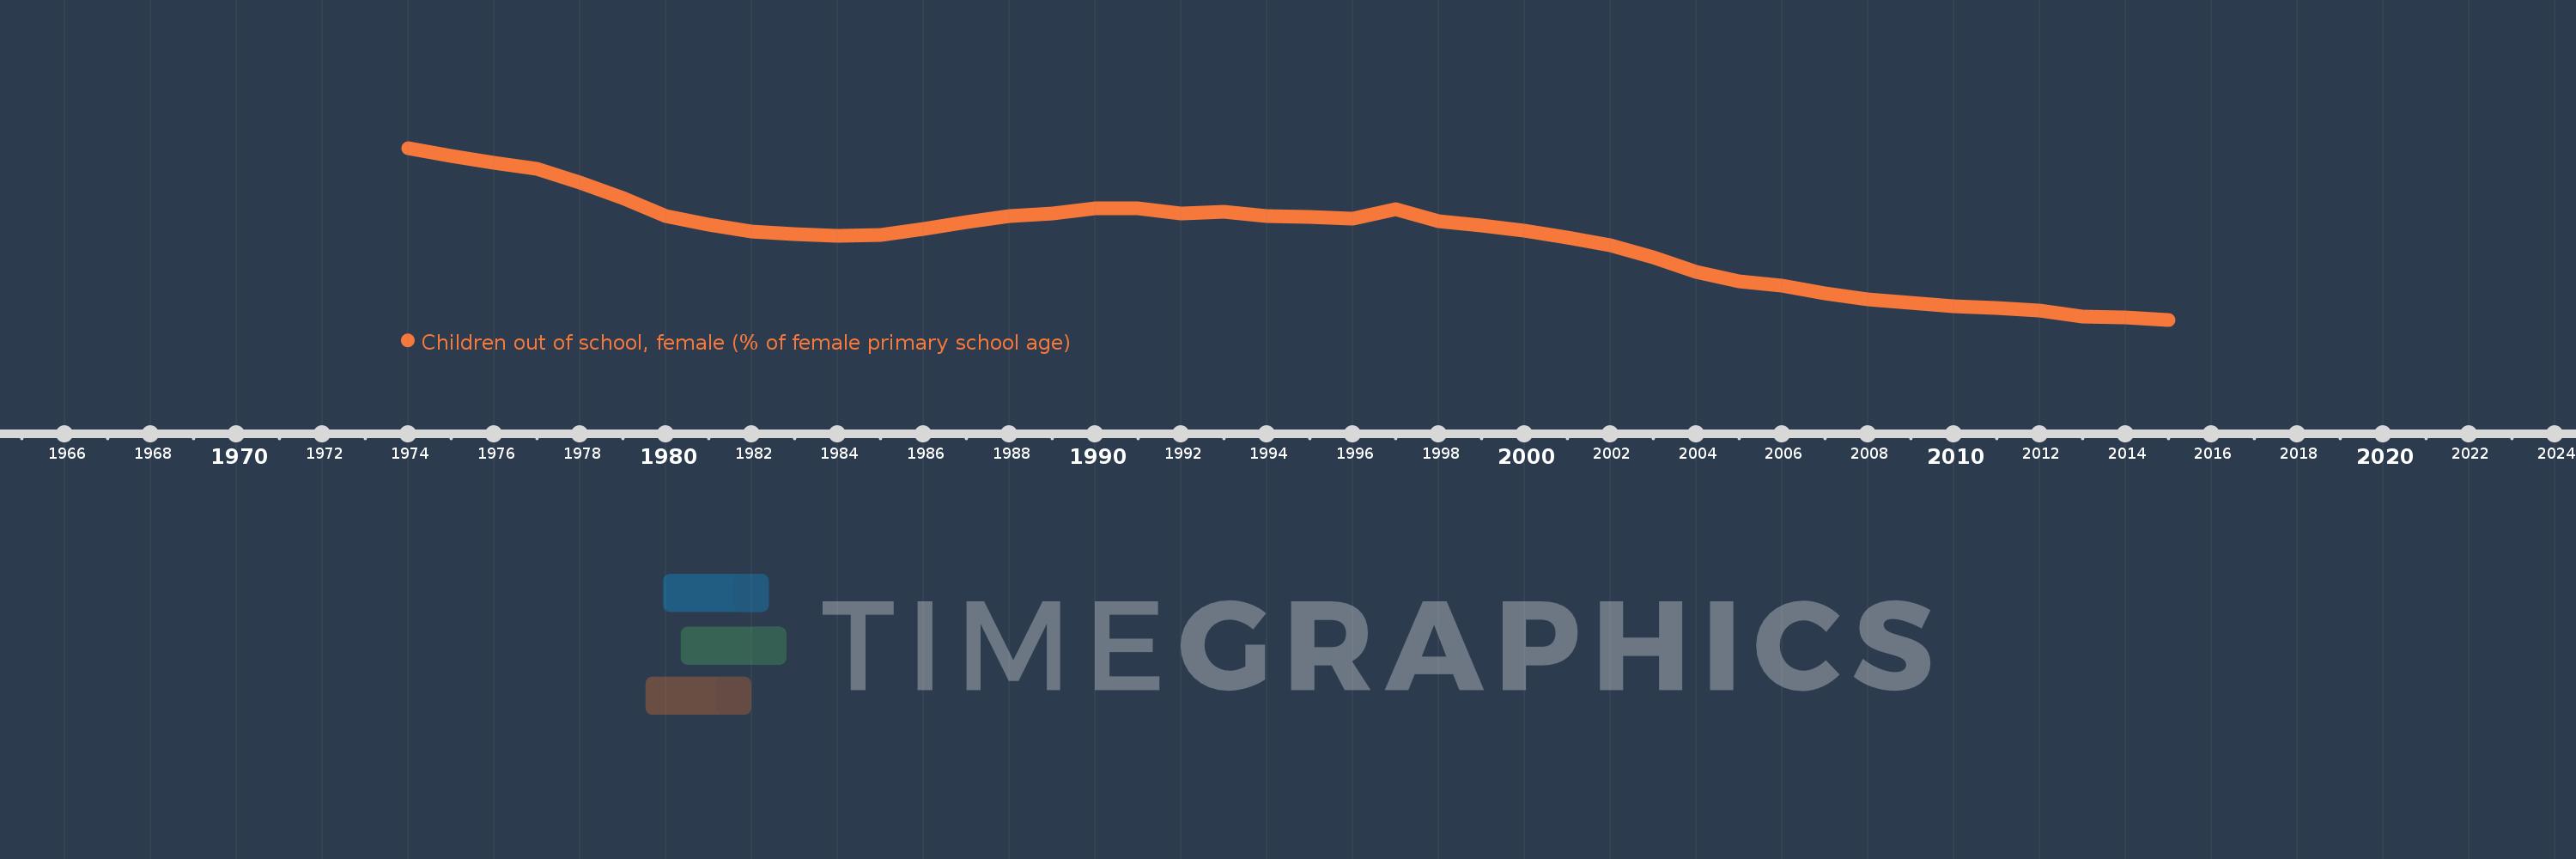
Children out of school, female (% of female primary school age)
2015,2014,2013,2012,2011,2010,2009,2008,2007,2006,2005,2004,2003,2002,2001,2000,1999,1998,1997,1996,1995,1994,1993,1992,1991,1990,1989,1988,1987,1986,1985,1984,1983,1982,1981,1980,1979,1978,1977,1976,1975,1974
This statistics in other country:
AfghanistanAlbaniaAlgeriaAngolaAntigua and BarbudaArab WorldArgentinaArmeniaArubaAustraliaAustriaAzerbaijanBahamas, TheBahrainBangladeshBarbadosBelarusBelgiumBelizeBeninBermudaBhutanBoliviaBosnia and HerzegovinaBotswanaBrazilBrunei DarussalamBulgariaBurkina FasoBurundiCabo VerdeCambodiaCameroonCanadaCaribbean small statesCentral African RepublicCentral Europe and the BalticsChadChileChinaColombiaComorosCongo, Dem. Rep.Congo, Rep.Costa RicaCote d'IvoireCroatiaCubaCyprusDenmarkDjiboutiDominicaDominican RepublicEarly-demographic dividendEast Asia & PacificEast Asia & Pacific (excluding high income)East Asia & Pacific (IDA & IBRD countries)EcuadorEgypt, Arab Rep.El SalvadorEquatorial GuineaEritreaEstoniaEthiopiaEuro areaEurope & Central AsiaEurope & Central Asia (excluding high income)Europe & Central Asia (IDA & IBRD countries)European UnionFijiFinlandFragile and conflict affected situationsFranceGabonGambia, TheGeorgiaGhanaGreeceGrenadaGuatemalaGuineaGuinea-BissauGuyanaHaitiHeavily indebted poor countries (HIPC)High incomeHondurasHong Kong SAR, ChinaHungaryIBRD onlyIcelandIDA & IBRD totalIDA blendIDA onlyIDA totalIndiaIndonesiaIran, Islamic Rep.IraqIrelandIsraelItalyJamaicaJapanJordanKazakhstanKenyaKiribatiKorea, Dem. People’s Rep.Korea, Rep.KuwaitKyrgyz RepublicLao PDRLate-demographic dividendLatin America & Caribbean Latin America & Caribbean (excluding high income)Latin America & the Caribbean (IDA & IBRD countries)LatviaLeast developed countries: UN classificationLebanonLesothoLiberiaLibyaLiechtensteinLithuaniaLow & middle incomeLow incomeLower middle incomeLuxembourgMacao SAR, ChinaMacedonia, FYRMadagascarMalawiMaldivesMaliMaltaMarshall IslandsMauritaniaMauritiusMexicoMicronesia, Fed. Sts.Middle East & North AfricaMiddle East & North Africa (excluding high income)Middle East & North Africa (IDA & IBRD countries)Middle incomeMoldovaMongoliaMontenegroMoroccoMozambiqueMyanmarNamibiaNauruNepalNetherlandsNew ZealandNicaraguaNigerNigeriaNorth AmericaNorwayOECD membersOmanOther small statesPacific island small statesPakistanPanamaPapua New GuineaParaguayPeruPhilippinesPolandPortugalPost-demographic dividendPre-demographic dividendPuerto RicoQatarRomaniaRussian FederationRwandaSamoaSan MarinoSao Tome and PrincipeSaudi ArabiaSenegalSerbiaSeychellesSierra LeoneSloveniaSmall statesSolomon IslandsSomaliaSouth AfricaSouth AsiaSouth Asia (IDA & IBRD)South SudanSpainSri LankaSt. Kitts and NevisSt. LuciaSt. Vincent and the GrenadinesSub-Saharan Africa Sub-Saharan Africa (excluding high income)Sub-Saharan Africa (IDA & IBRD countries)SudanSurinameSwazilandSwedenSwitzerlandSyrian Arab RepublicTajikistanTanzaniaThailandTimor-LesteTogoTongaTrinidad and TobagoTunisiaTurkeyTuvaluUgandaUkraineUnited Arab EmiratesUnited KingdomUnited StatesUpper middle incomeUruguayUzbekistanVanuatuVenezuela, RBWest Bank and GazaWorldYemen, Rep.ZambiaZimbabwe Timeline:
This timeline shows a graph from 1974 to 2015 of Pre-demographic dividend. No data until 1973. Number of actual observations by date: 42.
Source name:
World Development Indicators
Source organization:
United Nations Educational, Scientific, and Cultural Organization (UNESCO) Institute for Statistics.
Categories, topics:
Education
Last updated:
apr 23, 2017
Indicators value changes by year
Minimum:
26.682
jan 1, 2015
At the date of observation
Value
Absolute change
Change from previous value
jan 1, 1974
68.73
+68.73
0.0%
jan 1, 1975
66.772
-1.957
-2.85%
jan 1, 1976
65.089
-1.684
-2.52%
jan 1, 1977
63.553
-1.536
-2.36%
jan 1, 1978
60.341
-3.212
-5.05%
jan 1, 1979
56.466
-3.874
-6.42%
jan 1, 1980
51.973
-4.493
-7.96%
jan 1, 1981
49.872
-2.101
-4.04%
jan 1, 1982
48.212
-1.66
-3.33%
jan 1, 1983
47.659
-0.552
-1.15%
jan 1, 1984
47.164
-0.496
-1.04%
jan 1, 1985
47.521
+0.358
0.76%
jan 1, 1986
48.856
+1.335
2.81%
jan 1, 1987
50.62
+1.764
3.61%
jan 1, 1988
52.105
+1.485
2.93%
jan 1, 1989
52.648
+0.543
1.04%
jan 1, 1990
53.967
+1.319
2.51%
jan 1, 1991
53.953
-0.014
-0.03%
jan 1, 1992
52.681
-1.271
-2.36%
jan 1, 1993
53.09
+0.409
0.78%
jan 1, 1994
52.119
-0.971
-1.83%
jan 1, 1995
51.838
-0.281
-0.54%
jan 1, 1996
51.381
-0.457
-0.88%
jan 1, 1997
53.741
+2.36
4.59%
jan 1, 1998
50.84
-2.901
-5.4%
jan 1, 1999
49.647
-1.193
-2.35%
jan 1, 2000
48.575
-1.073
-2.16%
jan 1, 2001
46.858
-1.717
-3.53%
jan 1, 2002
44.918
-1.94
-4.14%
jan 1, 2003
41.984
-2.934
-6.53%
jan 1, 2004
38.348
-3.636
-8.66%
jan 1, 2005
36.082
-2.266
-5.91%
jan 1, 2006
34.985
-1.097
-3.04%
jan 1, 2007
33.097
-1.888
-5.4%
jan 1, 2008
31.638
-1.459
-4.41%
jan 1, 2009
30.744
-0.894
-2.82%
jan 1, 2010
30.077
-0.667
-2.17%
jan 1, 2011
29.642
-0.436
-1.45%
jan 1, 2012
28.843
-0.799
-2.69%
jan 1, 2013
27.487
-1.356
-4.7%
jan 1, 2014
27.327
-0.16
-0.58%
jan 1, 2015
26.682
-0.645
-2.36%
Ranking of countries by current statistics by years


Comments: