29
/
en
AIzaSyAYiBZKx7MnpbEhh9jyipgxe19OcubqV5w
April 1, 2024
60598
Sub-Saharan Africa (IDA & IBRD countries)
TSS
false
2
1
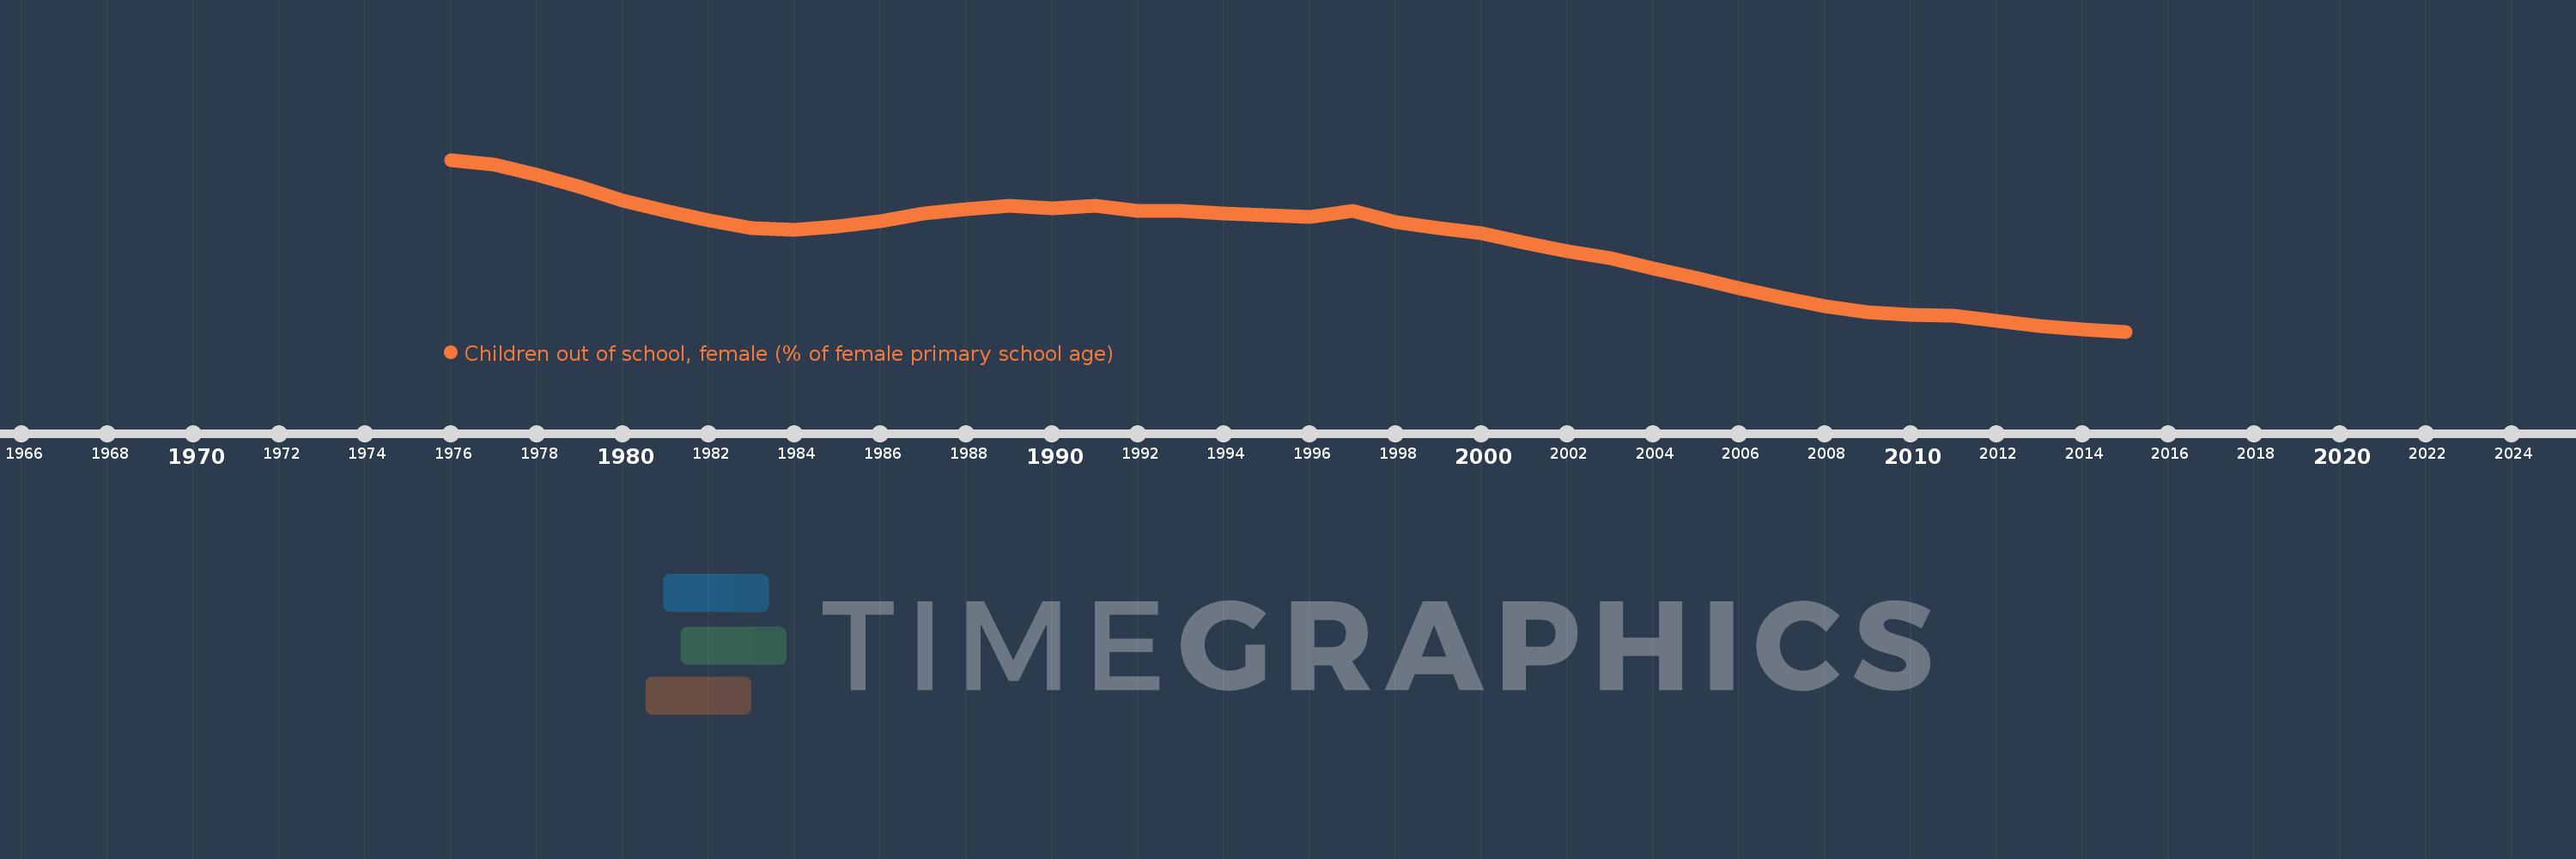
Children out of school, female (% of female primary school age)
2015,2014,2013,2012,2011,2010,2009,2008,2007,2006,2005,2004,2003,2002,2001,2000,1999,1998,1997,1996,1995,1994,1993,1992,1991,1990,1989,1988,1987,1986,1985,1984,1983,1982,1981,1980,1979,1978,1977,1976
This statistics in other country:
AfghanistanAlbaniaAlgeriaAngolaAntigua and BarbudaArab WorldArgentinaArmeniaArubaAustraliaAustriaAzerbaijanBahamas, TheBahrainBangladeshBarbadosBelarusBelgiumBelizeBeninBermudaBhutanBoliviaBosnia and HerzegovinaBotswanaBrazilBrunei DarussalamBulgariaBurkina FasoBurundiCabo VerdeCambodiaCameroonCanadaCaribbean small statesCentral African RepublicCentral Europe and the BalticsChadChileChinaColombiaComorosCongo, Dem. Rep.Congo, Rep.Costa RicaCote d'IvoireCroatiaCubaCyprusDenmarkDjiboutiDominicaDominican RepublicEarly-demographic dividendEast Asia & PacificEast Asia & Pacific (excluding high income)East Asia & Pacific (IDA & IBRD countries)EcuadorEgypt, Arab Rep.El SalvadorEquatorial GuineaEritreaEstoniaEthiopiaEuro areaEurope & Central AsiaEurope & Central Asia (excluding high income)Europe & Central Asia (IDA & IBRD countries)European UnionFijiFinlandFragile and conflict affected situationsFranceGabonGambia, TheGeorgiaGhanaGreeceGrenadaGuatemalaGuineaGuinea-BissauGuyanaHaitiHeavily indebted poor countries (HIPC)High incomeHondurasHong Kong SAR, ChinaHungaryIBRD onlyIcelandIDA & IBRD totalIDA blendIDA onlyIDA totalIndiaIndonesiaIran, Islamic Rep.IraqIrelandIsraelItalyJamaicaJapanJordanKazakhstanKenyaKiribatiKorea, Dem. People’s Rep.Korea, Rep.KuwaitKyrgyz RepublicLao PDRLate-demographic dividendLatin America & Caribbean Latin America & Caribbean (excluding high income)Latin America & the Caribbean (IDA & IBRD countries)LatviaLeast developed countries: UN classificationLebanonLesothoLiberiaLibyaLiechtensteinLithuaniaLow & middle incomeLow incomeLower middle incomeLuxembourgMacao SAR, ChinaMacedonia, FYRMadagascarMalawiMaldivesMaliMaltaMarshall IslandsMauritaniaMauritiusMexicoMicronesia, Fed. Sts.Middle East & North AfricaMiddle East & North Africa (excluding high income)Middle East & North Africa (IDA & IBRD countries)Middle incomeMoldovaMongoliaMontenegroMoroccoMozambiqueMyanmarNamibiaNauruNepalNetherlandsNew ZealandNicaraguaNigerNigeriaNorth AmericaNorwayOECD membersOmanOther small statesPacific island small statesPakistanPanamaPapua New GuineaParaguayPeruPhilippinesPolandPortugalPost-demographic dividendPre-demographic dividendPuerto RicoQatarRomaniaRussian FederationRwandaSamoaSan MarinoSao Tome and PrincipeSaudi ArabiaSenegalSerbiaSeychellesSierra LeoneSloveniaSmall statesSolomon IslandsSomaliaSouth AfricaSouth AsiaSouth Asia (IDA & IBRD)South SudanSpainSri LankaSt. Kitts and NevisSt. LuciaSt. Vincent and the GrenadinesSub-Saharan Africa Sub-Saharan Africa (excluding high income)Sub-Saharan Africa (IDA & IBRD countries)SudanSurinameSwazilandSwedenSwitzerlandSyrian Arab RepublicTajikistanTanzaniaThailandTimor-LesteTogoTongaTrinidad and TobagoTunisiaTurkeyTuvaluUgandaUkraineUnited Arab EmiratesUnited KingdomUnited StatesUpper middle incomeUruguayUzbekistanVanuatuVenezuela, RBWest Bank and GazaWorldYemen, Rep.ZambiaZimbabwe Timeline:
This timeline shows a graph from 1976 to 2015 of Sub-Saharan Africa (IDA & IBRD countries). No data until 1975. Number of actual observations by date: 40.
Source name:
World Development Indicators
Source organization:
United Nations Educational, Scientific, and Cultural Organization (UNESCO) Institute for Statistics.
Categories, topics:
Education
Last updated:
apr 23, 2017
Indicators value changes by year
Minimum:
23.296
jan 1, 2015
Maximum:
62.095
jan 1, 1976
At the date of observation
Value
Absolute change
Change from previous value
jan 1, 1976
62.095
+62.095
0.0%
jan 1, 1977
61.07
-1.025
-1.65%
jan 1, 1978
58.657
-2.413
-3.95%
jan 1, 1979
56.064
-2.592
-4.42%
jan 1, 1980
52.904
-3.161
-5.64%
jan 1, 1981
50.546
-2.358
-4.46%
jan 1, 1982
48.364
-2.182
-4.32%
jan 1, 1983
46.709
-1.655
-3.42%
jan 1, 1984
46.35
-0.359
-0.77%
jan 1, 1985
46.973
+0.623
1.34%
jan 1, 1986
48.225
+1.252
2.67%
jan 1, 1987
49.884
+1.659
3.44%
jan 1, 1988
50.993
+1.109
2.22%
jan 1, 1989
51.63
+0.637
1.25%
jan 1, 1990
51.188
-0.442
-0.86%
jan 1, 1991
51.672
+0.484
0.95%
jan 1, 1992
50.516
-1.156
-2.24%
jan 1, 1993
50.557
+0.041
0.08%
jan 1, 1994
49.991
-0.566
-1.12%
jan 1, 1995
49.65
-0.341
-0.68%
jan 1, 1996
49.17
-0.48
-0.97%
jan 1, 1997
50.644
+1.474
3.0%
jan 1, 1998
47.96
-2.684
-5.3%
jan 1, 1999
46.598
-1.362
-2.84%
jan 1, 2000
45.452
-1.146
-2.46%
jan 1, 2001
43.434
-2.018
-4.44%
jan 1, 2002
41.511
-1.923
-4.43%
jan 1, 2003
39.938
-1.572
-3.79%
jan 1, 2004
37.461
-2.478
-6.2%
jan 1, 2005
35.421
-2.039
-5.44%
jan 1, 2006
33.079
-2.343
-6.61%
jan 1, 2007
31.039
-2.04
-6.17%
jan 1, 2008
29.046
-1.993
-6.42%
jan 1, 2009
27.662
-1.384
-4.77%
jan 1, 2010
27.055
-0.606
-2.19%
jan 1, 2011
26.918
-0.137
-0.51%
jan 1, 2012
25.71
-1.208
-4.49%
jan 1, 2013
24.62
-1.09
-4.24%
jan 1, 2014
23.838
-0.782
-3.18%
jan 1, 2015
23.296
-0.541
-2.27%
Ranking of countries by current statistics by years


Comments: