29
/
en
AIzaSyAYiBZKx7MnpbEhh9jyipgxe19OcubqV5w
April 1, 2024
39751
IDA total
IDA
false
2
1
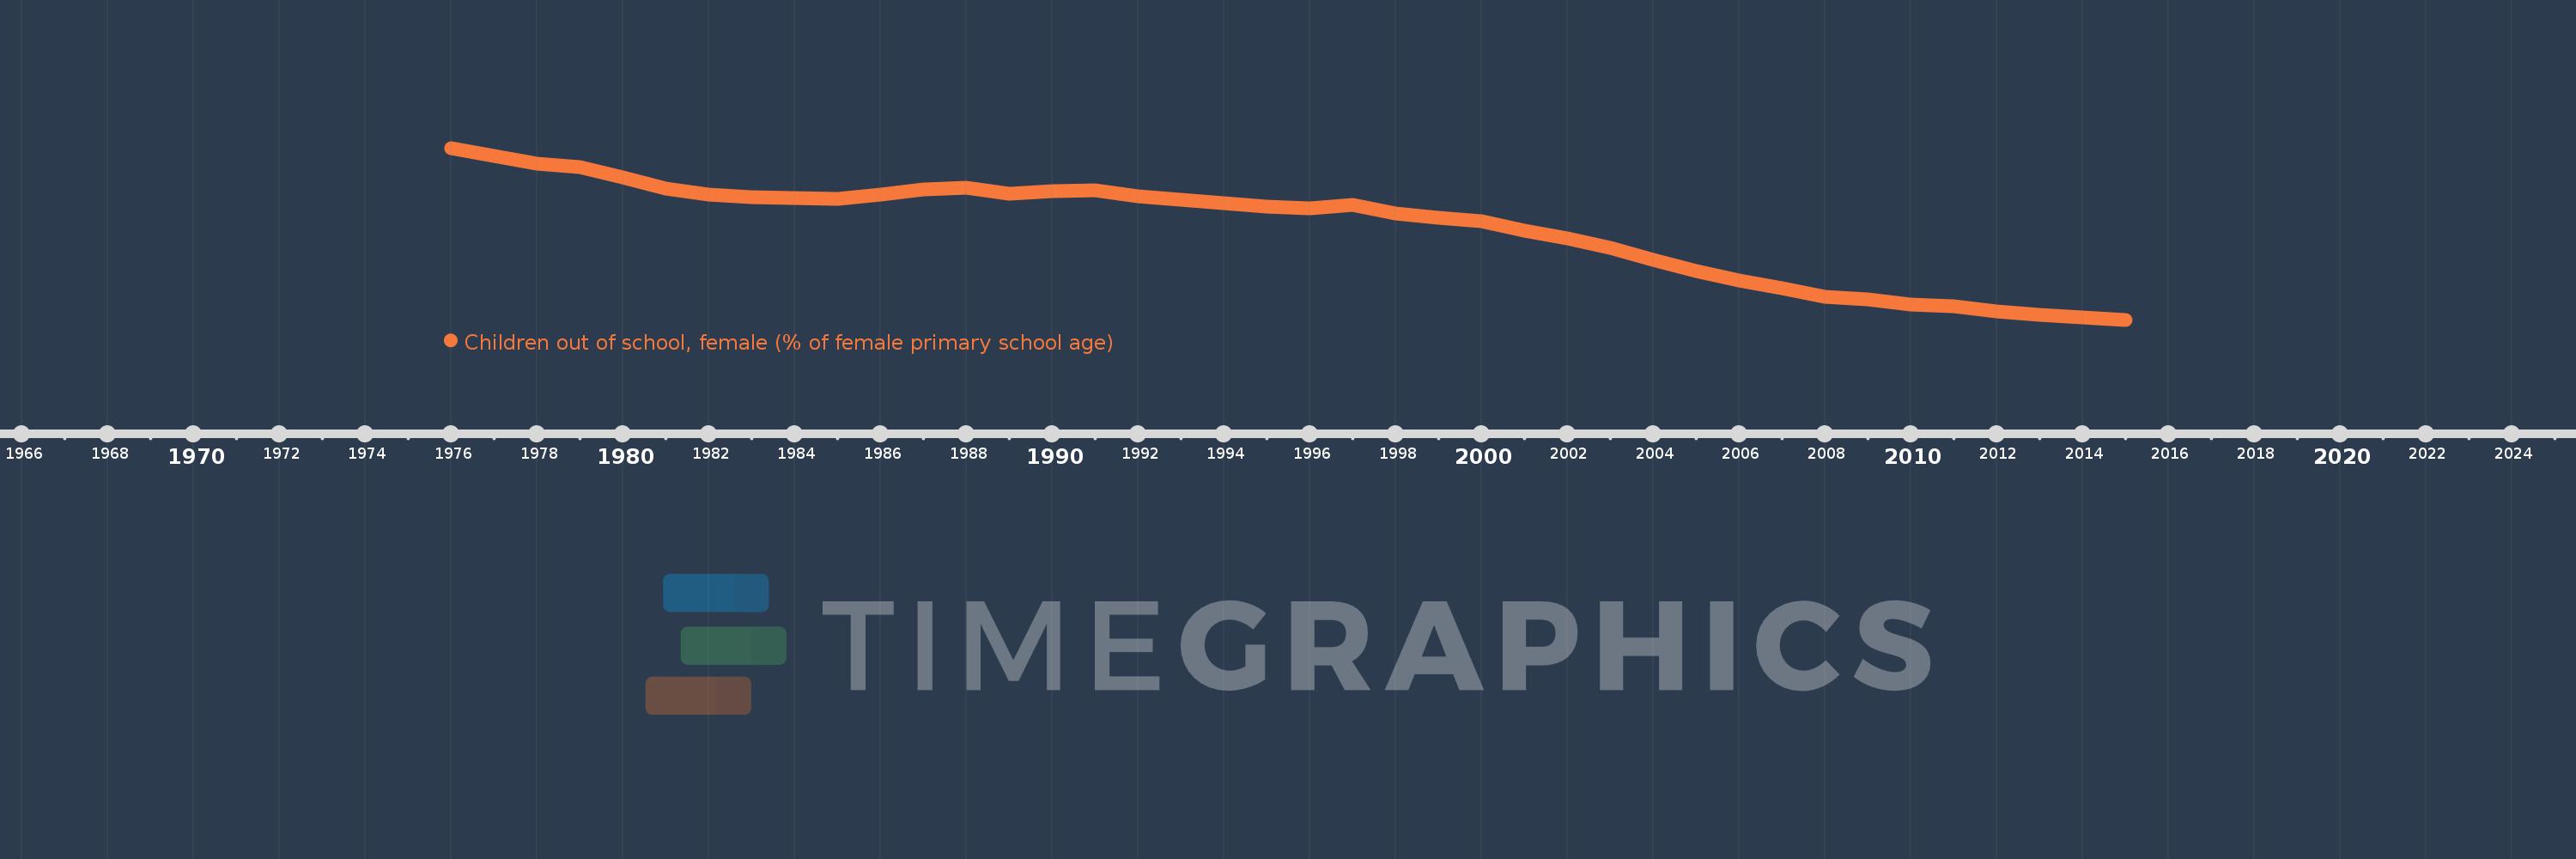
Children out of school, female (% of female primary school age)
2015,2014,2013,2012,2011,2010,2009,2008,2007,2006,2005,2004,2003,2002,2001,2000,1999,1998,1997,1996,1995,1994,1993,1992,1991,1990,1989,1988,1987,1986,1985,1984,1983,1982,1981,1980,1979,1978,1977,1976
This statistics in other country:
AfghanistanAlbaniaAlgeriaAngolaAntigua and BarbudaArab WorldArgentinaArmeniaArubaAustraliaAustriaAzerbaijanBahamas, TheBahrainBangladeshBarbadosBelarusBelgiumBelizeBeninBermudaBhutanBoliviaBosnia and HerzegovinaBotswanaBrazilBrunei DarussalamBulgariaBurkina FasoBurundiCabo VerdeCambodiaCameroonCanadaCaribbean small statesCentral African RepublicCentral Europe and the BalticsChadChileChinaColombiaComorosCongo, Dem. Rep.Congo, Rep.Costa RicaCote d'IvoireCroatiaCubaCyprusDenmarkDjiboutiDominicaDominican RepublicEarly-demographic dividendEast Asia & PacificEast Asia & Pacific (excluding high income)East Asia & Pacific (IDA & IBRD countries)EcuadorEgypt, Arab Rep.El SalvadorEquatorial GuineaEritreaEstoniaEthiopiaEuro areaEurope & Central AsiaEurope & Central Asia (excluding high income)Europe & Central Asia (IDA & IBRD countries)European UnionFijiFinlandFragile and conflict affected situationsFranceGabonGambia, TheGeorgiaGhanaGreeceGrenadaGuatemalaGuineaGuinea-BissauGuyanaHaitiHeavily indebted poor countries (HIPC)High incomeHondurasHong Kong SAR, ChinaHungaryIBRD onlyIcelandIDA & IBRD totalIDA blendIDA onlyIDA totalIndiaIndonesiaIran, Islamic Rep.IraqIrelandIsraelItalyJamaicaJapanJordanKazakhstanKenyaKiribatiKorea, Dem. People’s Rep.Korea, Rep.KuwaitKyrgyz RepublicLao PDRLate-demographic dividendLatin America & Caribbean Latin America & Caribbean (excluding high income)Latin America & the Caribbean (IDA & IBRD countries)LatviaLeast developed countries: UN classificationLebanonLesothoLiberiaLibyaLiechtensteinLithuaniaLow & middle incomeLow incomeLower middle incomeLuxembourgMacao SAR, ChinaMacedonia, FYRMadagascarMalawiMaldivesMaliMaltaMarshall IslandsMauritaniaMauritiusMexicoMicronesia, Fed. Sts.Middle East & North AfricaMiddle East & North Africa (excluding high income)Middle East & North Africa (IDA & IBRD countries)Middle incomeMoldovaMongoliaMontenegroMoroccoMozambiqueMyanmarNamibiaNauruNepalNetherlandsNew ZealandNicaraguaNigerNigeriaNorth AmericaNorwayOECD membersOmanOther small statesPacific island small statesPakistanPanamaPapua New GuineaParaguayPeruPhilippinesPolandPortugalPost-demographic dividendPre-demographic dividendPuerto RicoQatarRomaniaRussian FederationRwandaSamoaSan MarinoSao Tome and PrincipeSaudi ArabiaSenegalSerbiaSeychellesSierra LeoneSloveniaSmall statesSolomon IslandsSomaliaSouth AfricaSouth AsiaSouth Asia (IDA & IBRD)South SudanSpainSri LankaSt. Kitts and NevisSt. LuciaSt. Vincent and the GrenadinesSub-Saharan Africa Sub-Saharan Africa (excluding high income)Sub-Saharan Africa (IDA & IBRD countries)SudanSurinameSwazilandSwedenSwitzerlandSyrian Arab RepublicTajikistanTanzaniaThailandTimor-LesteTogoTongaTrinidad and TobagoTunisiaTurkeyTuvaluUgandaUkraineUnited Arab EmiratesUnited KingdomUnited StatesUpper middle incomeUruguayUzbekistanVanuatuVenezuela, RBWest Bank and GazaWorldYemen, Rep.ZambiaZimbabwe Timeline:
This timeline shows a graph from 1976 to 2015 of IDA total. No data until 1975. Number of actual observations by date: 40.
Source name:
World Development Indicators
Source organization:
United Nations Educational, Scientific, and Cultural Organization (UNESCO) Institute for Statistics.
Categories, topics:
Education
Last updated:
apr 23, 2017
Indicators value changes by year
Minimum:
21.632
jan 1, 2015
Maximum:
56.175
jan 1, 1976
At the date of observation
Value
Absolute change
Change from previous value
jan 1, 1976
56.175
+56.175
0.0%
jan 1, 1977
54.546
-1.629
-2.9%
jan 1, 1978
53.004
-1.543
-2.83%
jan 1, 1979
52.243
-0.76
-1.43%
jan 1, 1980
50.335
-1.908
-3.65%
jan 1, 1981
48.087
-2.248
-4.47%
jan 1, 1982
46.731
-1.355
-2.82%
jan 1, 1983
46.308
-0.423
-0.91%
jan 1, 1984
46.094
-0.214
-0.46%
jan 1, 1985
46.013
-0.081
-0.18%
jan 1, 1986
46.831
+0.818
1.78%
jan 1, 1987
47.862
+1.031
2.2%
jan 1, 1988
48.202
+0.34
0.71%
jan 1, 1989
47.055
-1.147
-2.38%
jan 1, 1990
47.46
+0.405
0.86%
jan 1, 1991
47.692
+0.232
0.49%
jan 1, 1992
46.446
-1.246
-2.61%
jan 1, 1993
45.835
-0.611
-1.32%
jan 1, 1994
45.094
-0.74
-1.62%
jan 1, 1995
44.402
-0.693
-1.54%
jan 1, 1996
43.963
-0.439
-0.99%
jan 1, 1997
44.671
+0.708
1.61%
jan 1, 1998
42.979
-1.692
-3.79%
jan 1, 1999
42.127
-0.852
-1.98%
jan 1, 2000
41.45
-0.676
-1.61%
jan 1, 2001
39.476
-1.975
-4.76%
jan 1, 2002
38.039
-1.437
-3.64%
jan 1, 2003
36.089
-1.95
-5.13%
jan 1, 2004
33.69
-2.398
-6.65%
jan 1, 2005
31.39
-2.3
-6.83%
jan 1, 2006
29.527
-1.863
-5.94%
jan 1, 2007
28.028
-1.499
-5.08%
jan 1, 2008
26.222
-1.806
-6.44%
jan 1, 2009
25.686
-0.536
-2.04%
jan 1, 2010
24.668
-1.018
-3.97%
jan 1, 2011
24.394
-0.273
-1.11%
jan 1, 2012
23.378
-1.017
-4.17%
jan 1, 2013
22.545
-0.832
-3.56%
jan 1, 2014
22.11
-0.435
-1.93%
jan 1, 2015
21.632
-0.478
-2.16%
Ranking of countries by current statistics by years


Comments: