29
/
en
AIzaSyAYiBZKx7MnpbEhh9jyipgxe19OcubqV5w
April 1, 2024
159202
Ireland
IRL
true
2
1
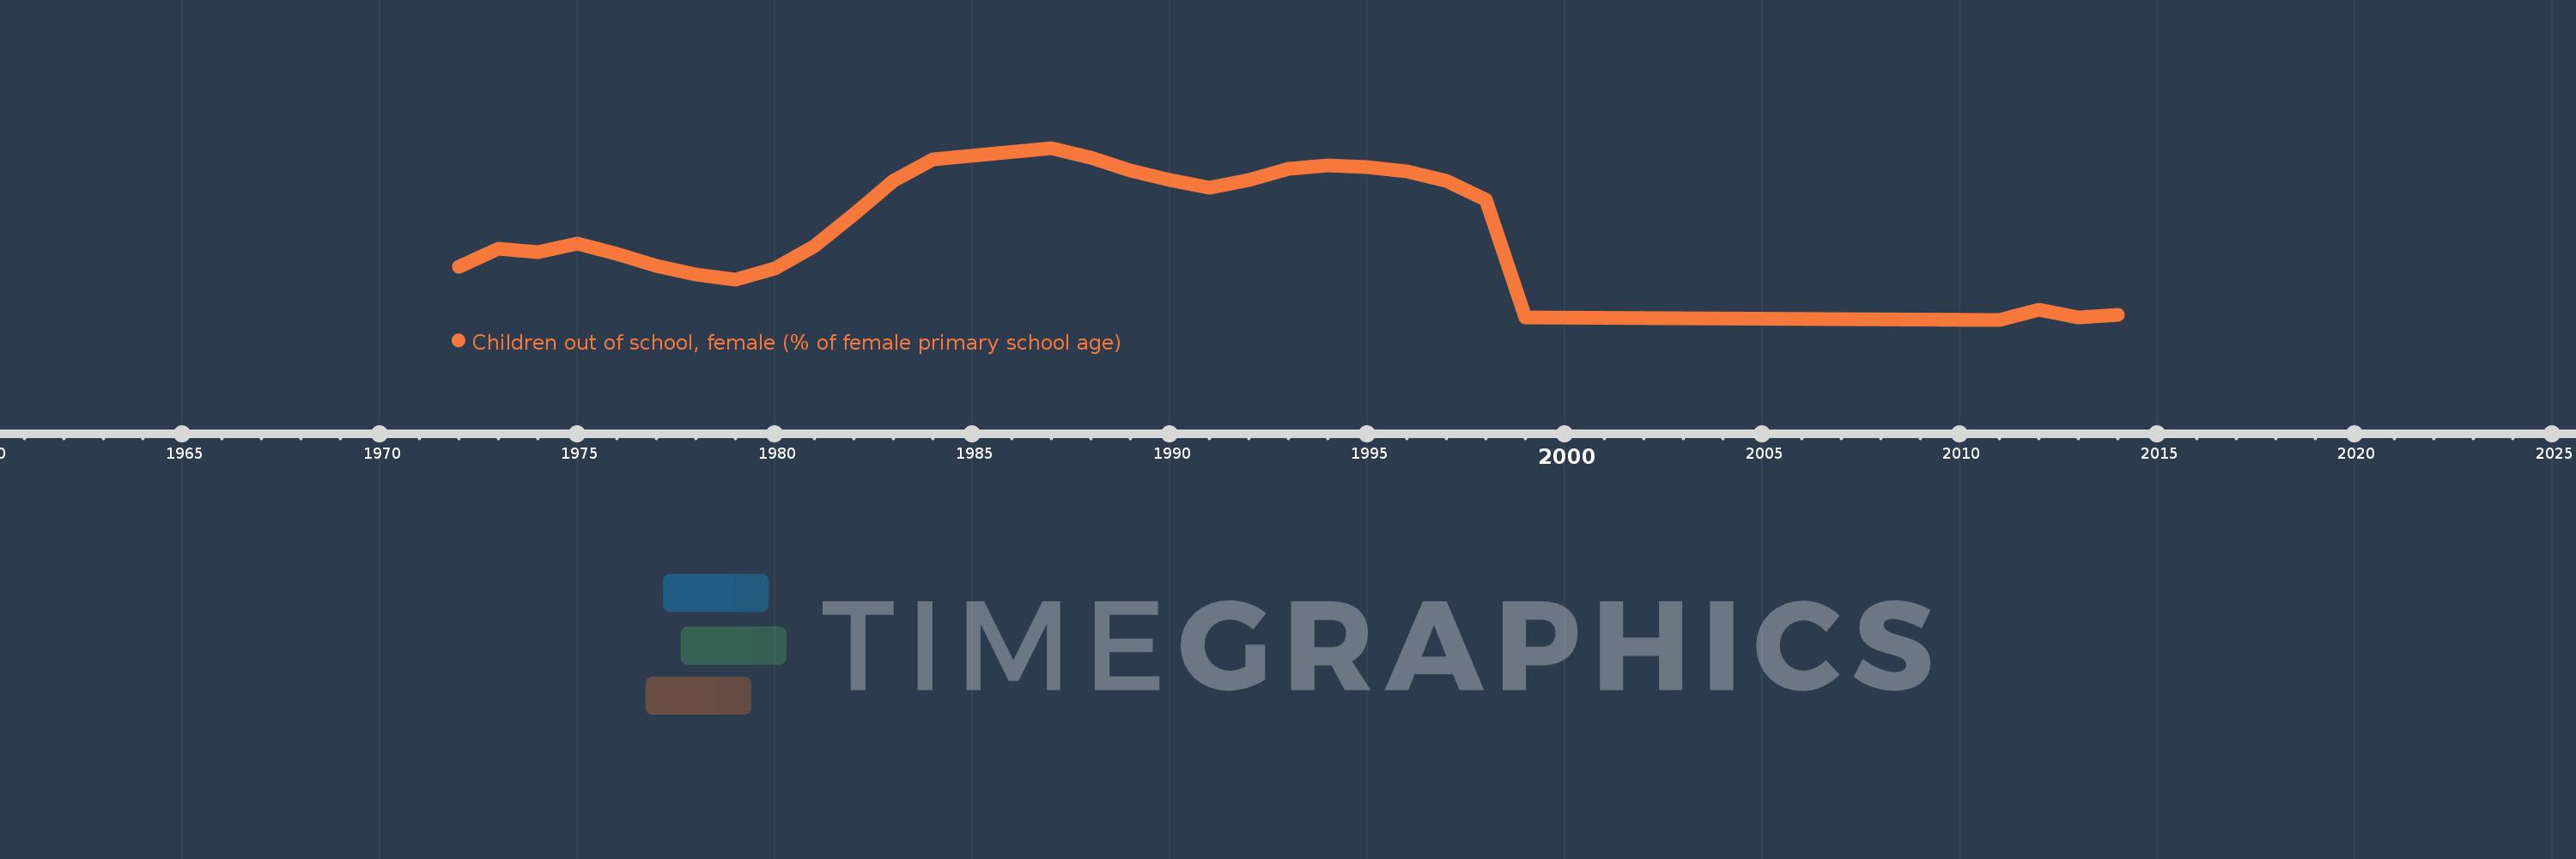
Children out of school, female (% of female primary school age)
2014,2013,2012,2011,1999,1998,1997,1996,1995,1994,1993,1992,1991,1990,1989,1988,1987,1984,1983,1982,1981,1980,1979,1978,1977,1976,1975,1974,1973,1972
This statistics in other country:
AfghanistanAlbaniaAlgeriaAngolaAntigua and BarbudaArab WorldArgentinaArmeniaArubaAustraliaAustriaAzerbaijanBahamas, TheBahrainBangladeshBarbadosBelarusBelgiumBelizeBeninBermudaBhutanBoliviaBosnia and HerzegovinaBotswanaBrazilBrunei DarussalamBulgariaBurkina FasoBurundiCabo VerdeCambodiaCameroonCanadaCaribbean small statesCentral African RepublicCentral Europe and the BalticsChadChileChinaColombiaComorosCongo, Dem. Rep.Congo, Rep.Costa RicaCote d'IvoireCroatiaCubaCyprusDenmarkDjiboutiDominicaDominican RepublicEarly-demographic dividendEast Asia & PacificEast Asia & Pacific (excluding high income)East Asia & Pacific (IDA & IBRD countries)EcuadorEgypt, Arab Rep.El SalvadorEquatorial GuineaEritreaEstoniaEthiopiaEuro areaEurope & Central AsiaEurope & Central Asia (excluding high income)Europe & Central Asia (IDA & IBRD countries)European UnionFijiFinlandFragile and conflict affected situationsFranceGabonGambia, TheGeorgiaGhanaGreeceGrenadaGuatemalaGuineaGuinea-BissauGuyanaHaitiHeavily indebted poor countries (HIPC)High incomeHondurasHong Kong SAR, ChinaHungaryIBRD onlyIcelandIDA & IBRD totalIDA blendIDA onlyIDA totalIndiaIndonesiaIran, Islamic Rep.IraqIrelandIsraelItalyJamaicaJapanJordanKazakhstanKenyaKiribatiKorea, Dem. People’s Rep.Korea, Rep.KuwaitKyrgyz RepublicLao PDRLate-demographic dividendLatin America & Caribbean Latin America & Caribbean (excluding high income)Latin America & the Caribbean (IDA & IBRD countries)LatviaLeast developed countries: UN classificationLebanonLesothoLiberiaLibyaLiechtensteinLithuaniaLow & middle incomeLow incomeLower middle incomeLuxembourgMacao SAR, ChinaMacedonia, FYRMadagascarMalawiMaldivesMaliMaltaMarshall IslandsMauritaniaMauritiusMexicoMicronesia, Fed. Sts.Middle East & North AfricaMiddle East & North Africa (excluding high income)Middle East & North Africa (IDA & IBRD countries)Middle incomeMoldovaMongoliaMontenegroMoroccoMozambiqueMyanmarNamibiaNauruNepalNetherlandsNew ZealandNicaraguaNigerNigeriaNorth AmericaNorwayOECD membersOmanOther small statesPacific island small statesPakistanPanamaPapua New GuineaParaguayPeruPhilippinesPolandPortugalPost-demographic dividendPre-demographic dividendPuerto RicoQatarRomaniaRussian FederationRwandaSamoaSan MarinoSao Tome and PrincipeSaudi ArabiaSenegalSerbiaSeychellesSierra LeoneSloveniaSmall statesSolomon IslandsSomaliaSouth AfricaSouth AsiaSouth Asia (IDA & IBRD)South SudanSpainSri LankaSt. Kitts and NevisSt. LuciaSt. Vincent and the GrenadinesSub-Saharan Africa Sub-Saharan Africa (excluding high income)Sub-Saharan Africa (IDA & IBRD countries)SudanSurinameSwazilandSwedenSwitzerlandSyrian Arab RepublicTajikistanTanzaniaThailandTimor-LesteTogoTongaTrinidad and TobagoTunisiaTurkeyTuvaluUgandaUkraineUnited Arab EmiratesUnited KingdomUnited StatesUpper middle incomeUruguayUzbekistanVanuatuVenezuela, RBWest Bank and GazaWorldYemen, Rep.ZambiaZimbabwe Timeline:
This timeline shows a graph from 1972 to 2014 of Ireland. No data until 1971. Number of actual observations by date: 30.
Source name:
World Development Indicators
Source organization:
United Nations Educational, Scientific, and Cultural Organization (UNESCO) Institute for Statistics.
Categories, topics:
Education
Last updated:
apr 23, 2017
Indicators value changes by year
Maximum:
14.314
jan 1, 1987
At the date of observation
Value
Absolute change
Change from previous value
jan 1, 1972
4.458
+4.458
0.0%
jan 1, 1973
5.906
+1.447
32.46%
jan 1, 1974
5.673
-0.232
-3.93%
jan 1, 1975
6.322
+0.649
11.43%
jan 1, 1976
5.494
-0.828
-13.1%
jan 1, 1977
4.498
-0.996
-18.13%
jan 1, 1978
3.782
-0.716
-15.92%
jan 1, 1979
3.357
-0.425
-11.23%
jan 1, 1980
4.314
+0.957
28.5%
jan 1, 1981
6.146
+1.832
42.46%
jan 1, 1982
8.784
+2.638
42.93%
jan 1, 1983
11.549
+2.765
31.47%
jan 1, 1984
13.398
+1.849
16.01%
jan 1, 1987
14.314
+0.916
6.84%
jan 1, 1988
13.537
-0.777
-5.43%
jan 1, 1989
12.423
-1.114
-8.23%
jan 1, 1990
11.617
-0.806
-6.49%
jan 1, 1991
10.999
-0.618
-5.32%
jan 1, 1992
11.646
+0.646
5.88%
jan 1, 1993
12.563
+0.917
7.87%
jan 1, 1994
12.843
+0.28
2.23%
jan 1, 1995
12.694
-0.149
-1.16%
jan 1, 1996
12.378
-0.316
-2.49%
jan 1, 1997
11.589
-0.789
-6.37%
jan 1, 1998
10.036
-1.553
-13.4%
jan 1, 1999
0.226
-9.81
-97.75%
jan 1, 2011
0.011
-0.215
-95.28%
jan 1, 2012
0.865
+0.855
8.03K%
jan 1, 2013
0.183
-0.682
-78.82%
jan 1, 2014
0.391
+0.207
113.2%
Ranking of countries by current statistics by years


Comments: