29
/
en
AIzaSyAYiBZKx7MnpbEhh9jyipgxe19OcubqV5w
April 1, 2024
38789
IDA only
IDX
false
2
1
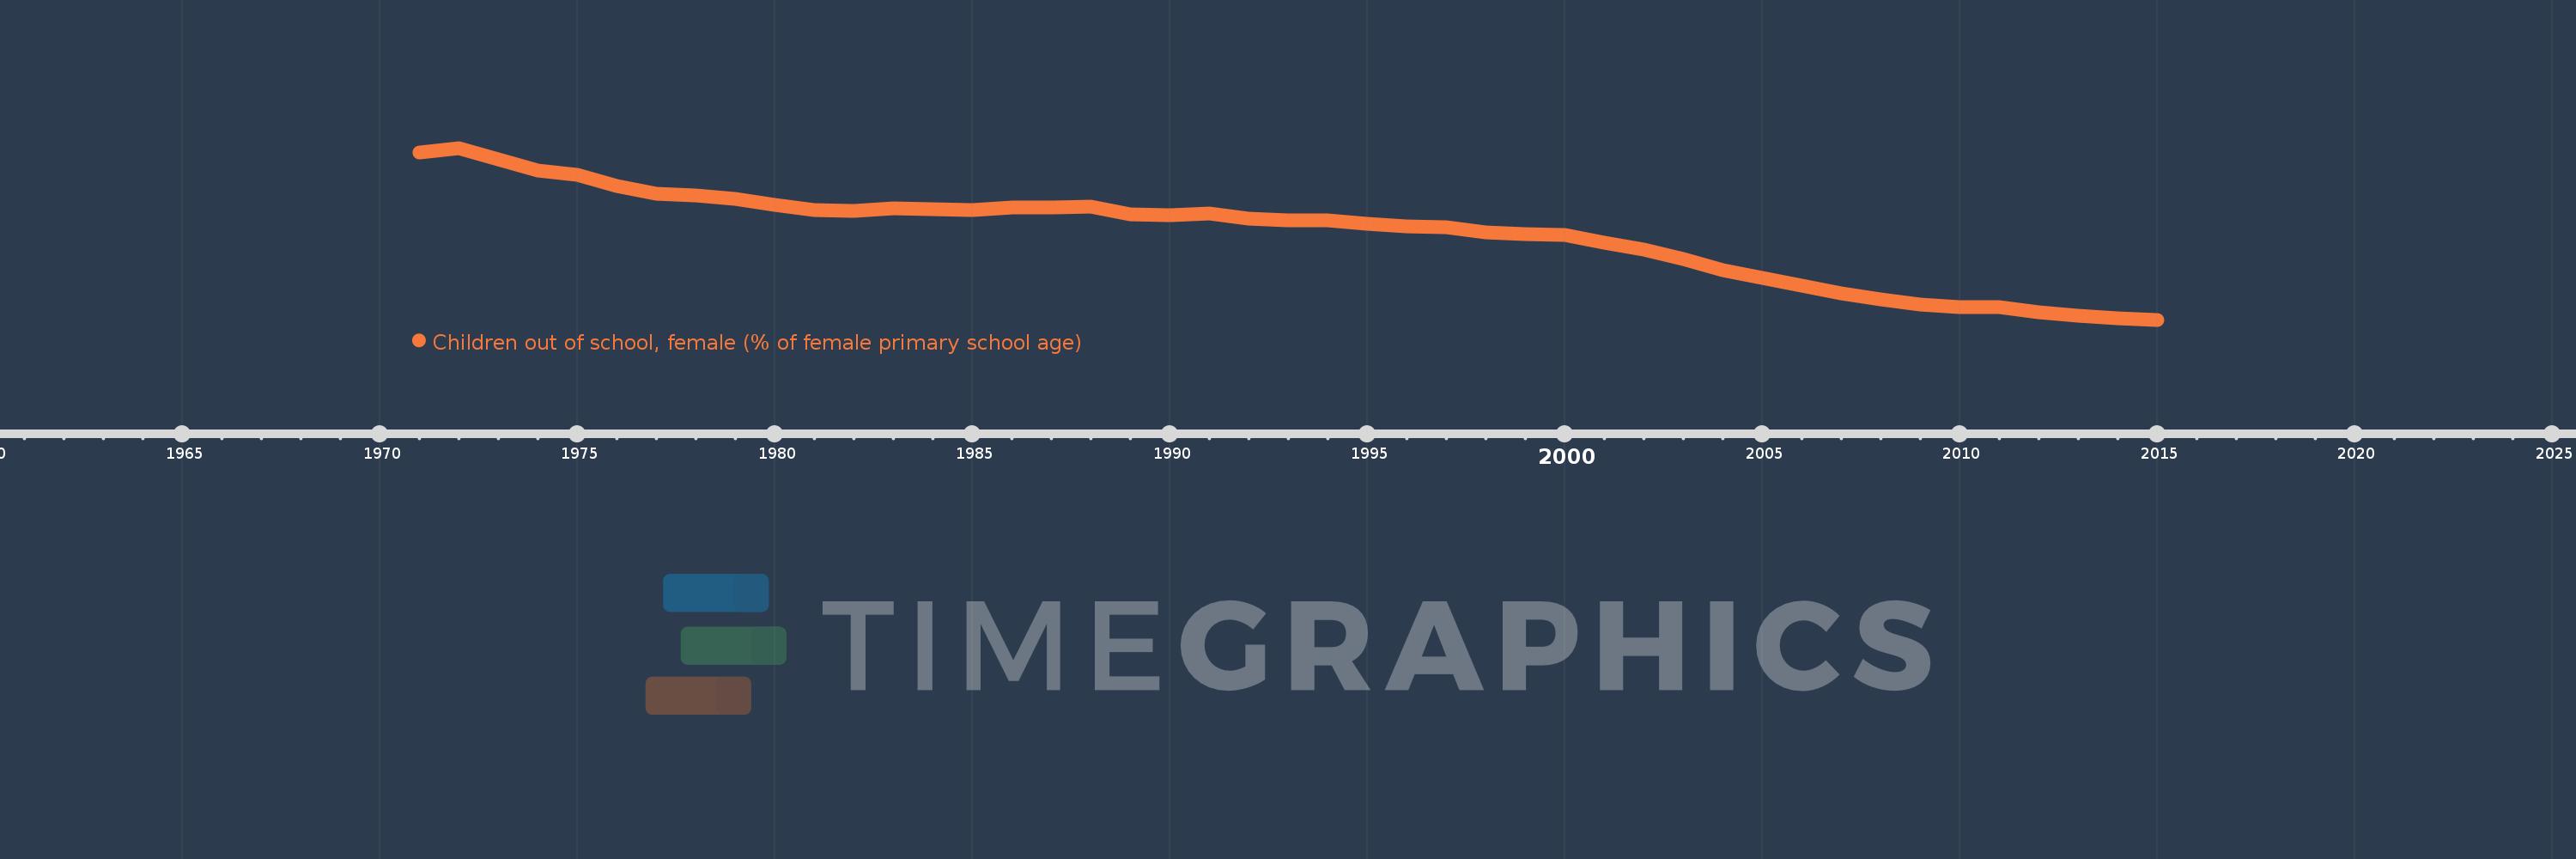
Children out of school, female (% of female primary school age)
2015,2014,2013,2012,2011,2010,2009,2008,2007,2006,2005,2004,2003,2002,2001,2000,1999,1998,1997,1996,1995,1994,1993,1992,1991,1990,1989,1988,1987,1986,1985,1984,1983,1982,1981,1980,1979,1978,1977,1976,1975,1974,1973,1972,1971
This statistics in other country:
AfghanistanAlbaniaAlgeriaAngolaAntigua and BarbudaArab WorldArgentinaArmeniaArubaAustraliaAustriaAzerbaijanBahamas, TheBahrainBangladeshBarbadosBelarusBelgiumBelizeBeninBermudaBhutanBoliviaBosnia and HerzegovinaBotswanaBrazilBrunei DarussalamBulgariaBurkina FasoBurundiCabo VerdeCambodiaCameroonCanadaCaribbean small statesCentral African RepublicCentral Europe and the BalticsChadChileChinaColombiaComorosCongo, Dem. Rep.Congo, Rep.Costa RicaCote d'IvoireCroatiaCubaCyprusDenmarkDjiboutiDominicaDominican RepublicEarly-demographic dividendEast Asia & PacificEast Asia & Pacific (excluding high income)East Asia & Pacific (IDA & IBRD countries)EcuadorEgypt, Arab Rep.El SalvadorEquatorial GuineaEritreaEstoniaEthiopiaEuro areaEurope & Central AsiaEurope & Central Asia (excluding high income)Europe & Central Asia (IDA & IBRD countries)European UnionFijiFinlandFragile and conflict affected situationsFranceGabonGambia, TheGeorgiaGhanaGreeceGrenadaGuatemalaGuineaGuinea-BissauGuyanaHaitiHeavily indebted poor countries (HIPC)High incomeHondurasHong Kong SAR, ChinaHungaryIBRD onlyIcelandIDA & IBRD totalIDA blendIDA onlyIDA totalIndiaIndonesiaIran, Islamic Rep.IraqIrelandIsraelItalyJamaicaJapanJordanKazakhstanKenyaKiribatiKorea, Dem. People’s Rep.Korea, Rep.KuwaitKyrgyz RepublicLao PDRLate-demographic dividendLatin America & Caribbean Latin America & Caribbean (excluding high income)Latin America & the Caribbean (IDA & IBRD countries)LatviaLeast developed countries: UN classificationLebanonLesothoLiberiaLibyaLiechtensteinLithuaniaLow & middle incomeLow incomeLower middle incomeLuxembourgMacao SAR, ChinaMacedonia, FYRMadagascarMalawiMaldivesMaliMaltaMarshall IslandsMauritaniaMauritiusMexicoMicronesia, Fed. Sts.Middle East & North AfricaMiddle East & North Africa (excluding high income)Middle East & North Africa (IDA & IBRD countries)Middle incomeMoldovaMongoliaMontenegroMoroccoMozambiqueMyanmarNamibiaNauruNepalNetherlandsNew ZealandNicaraguaNigerNigeriaNorth AmericaNorwayOECD membersOmanOther small statesPacific island small statesPakistanPanamaPapua New GuineaParaguayPeruPhilippinesPolandPortugalPost-demographic dividendPre-demographic dividendPuerto RicoQatarRomaniaRussian FederationRwandaSamoaSan MarinoSao Tome and PrincipeSaudi ArabiaSenegalSerbiaSeychellesSierra LeoneSloveniaSmall statesSolomon IslandsSomaliaSouth AfricaSouth AsiaSouth Asia (IDA & IBRD)South SudanSpainSri LankaSt. Kitts and NevisSt. LuciaSt. Vincent and the GrenadinesSub-Saharan Africa Sub-Saharan Africa (excluding high income)Sub-Saharan Africa (IDA & IBRD countries)SudanSurinameSwazilandSwedenSwitzerlandSyrian Arab RepublicTajikistanTanzaniaThailandTimor-LesteTogoTongaTrinidad and TobagoTunisiaTurkeyTuvaluUgandaUkraineUnited Arab EmiratesUnited KingdomUnited StatesUpper middle incomeUruguayUzbekistanVanuatuVenezuela, RBWest Bank and GazaWorldYemen, Rep.ZambiaZimbabwe Timeline:
This timeline shows a graph from 1971 to 2015 of IDA only. No data until 1970. Number of actual observations by date: 45.
Source name:
World Development Indicators
Source organization:
United Nations Educational, Scientific, and Cultural Organization (UNESCO) Institute for Statistics.
Categories, topics:
Education
Last updated:
apr 23, 2017
Indicators value changes by year
Minimum:
18.804
jan 1, 2015
Maximum:
70.882
jan 1, 1972
At the date of observation
Value
Absolute change
Change from previous value
jan 1, 1971
69.433
+69.433
0.0%
jan 1, 1972
70.882
+1.45
2.09%
jan 1, 1973
67.471
-3.411
-4.81%
jan 1, 1974
63.949
-3.522
-5.22%
jan 1, 1975
62.687
-1.262
-1.97%
jan 1, 1976
59.417
-3.27
-5.22%
jan 1, 1977
57.015
-2.402
-4.04%
jan 1, 1978
56.387
-0.628
-1.1%
jan 1, 1979
55.565
-0.822
-1.46%
jan 1, 1980
53.746
-1.819
-3.27%
jan 1, 1981
52.149
-1.598
-2.97%
jan 1, 1982
51.76
-0.388
-0.74%
jan 1, 1983
52.47
+0.709
1.37%
jan 1, 1984
52.394
-0.076
-0.14%
jan 1, 1985
52.121
-0.273
-0.52%
jan 1, 1986
52.82
+0.699
1.34%
jan 1, 1987
52.79
-0.029
-0.06%
jan 1, 1988
53.121
+0.331
0.63%
jan 1, 1989
50.641
-2.481
-4.67%
jan 1, 1990
50.623
-0.017
-0.03%
jan 1, 1991
51.029
+0.405
0.8%
jan 1, 1992
49.379
-1.649
-3.23%
jan 1, 1993
49.039
-0.34
-0.69%
jan 1, 1994
48.898
-0.142
-0.29%
jan 1, 1995
47.99
-0.908
-1.86%
jan 1, 1996
47.008
-0.981
-2.05%
jan 1, 1997
46.897
-0.111
-0.24%
jan 1, 1998
45.28
-1.617
-3.45%
jan 1, 1999
44.71
-0.57
-1.26%
jan 1, 2000
44.483
-0.228
-0.51%
jan 1, 2001
42.195
-2.287
-5.14%
jan 1, 2002
40.103
-2.092
-4.96%
jan 1, 2003
37.088
-3.015
-7.52%
jan 1, 2004
33.891
-3.197
-8.62%
jan 1, 2005
31.419
-2.472
-7.29%
jan 1, 2006
29.065
-2.354
-7.49%
jan 1, 2007
26.798
-2.267
-7.8%
jan 1, 2008
25.02
-1.777
-6.63%
jan 1, 2009
23.459
-1.562
-6.24%
jan 1, 2010
22.651
-0.808
-3.44%
jan 1, 2011
22.742
+0.091
0.4%
jan 1, 2012
21.195
-1.547
-6.8%
jan 1, 2013
20.064
-1.131
-5.34%
jan 1, 2014
19.195
-0.869
-4.33%
jan 1, 2015
18.804
-0.391
-2.04%
Ranking of countries by current statistics by years


Comments: