29
/
en
AIzaSyAYiBZKx7MnpbEhh9jyipgxe19OcubqV5w
April 1, 2024
41268
Latin America & Caribbean
LCN
false
2
1
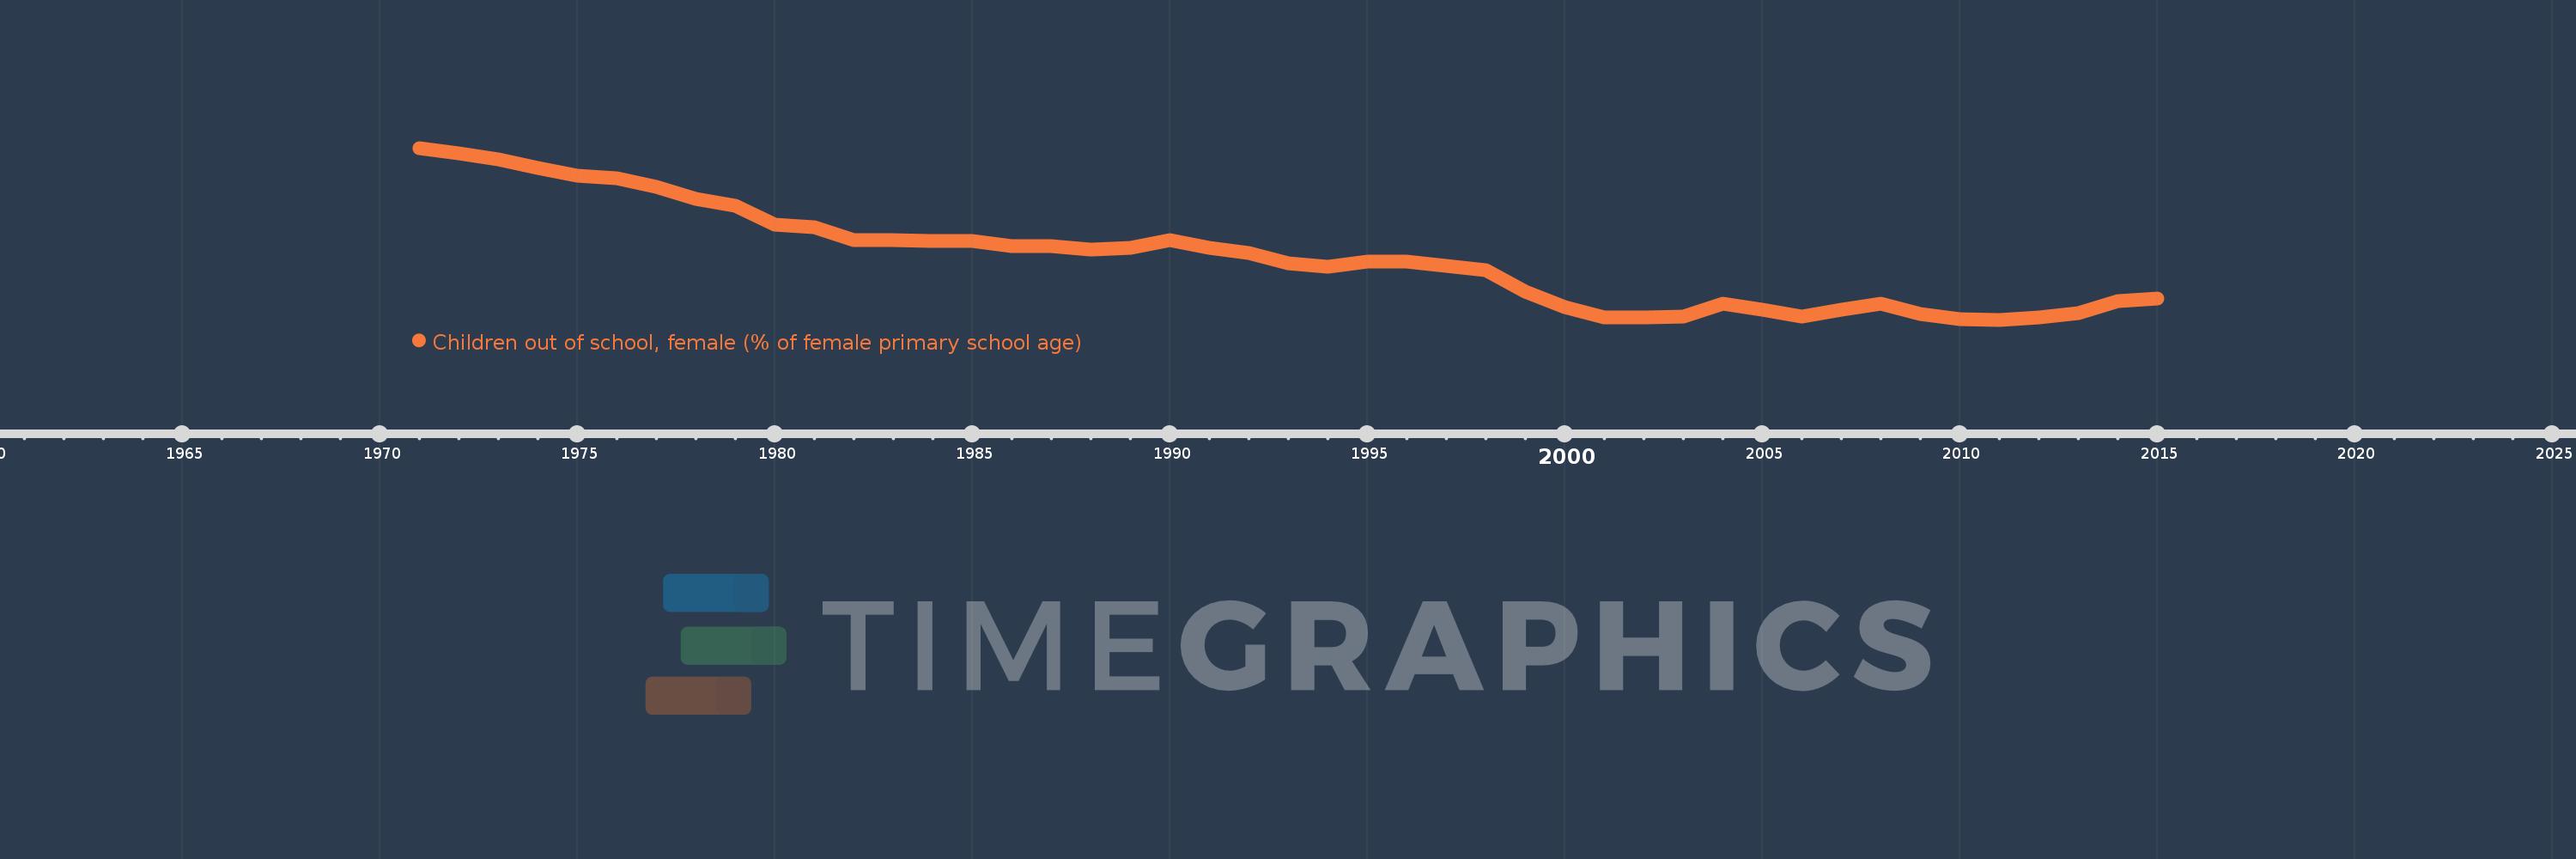
Children out of school, female (% of female primary school age)
2015,2014,2013,2012,2011,2010,2009,2008,2007,2006,2005,2004,2003,2002,2001,2000,1999,1998,1997,1996,1995,1994,1993,1992,1991,1990,1989,1988,1987,1986,1985,1984,1983,1982,1981,1980,1979,1978,1977,1976,1975,1974,1973,1972,1971
This statistics in other country:
AfghanistanAlbaniaAlgeriaAngolaAntigua and BarbudaArab WorldArgentinaArmeniaArubaAustraliaAustriaAzerbaijanBahamas, TheBahrainBangladeshBarbadosBelarusBelgiumBelizeBeninBermudaBhutanBoliviaBosnia and HerzegovinaBotswanaBrazilBrunei DarussalamBulgariaBurkina FasoBurundiCabo VerdeCambodiaCameroonCanadaCaribbean small statesCentral African RepublicCentral Europe and the BalticsChadChileChinaColombiaComorosCongo, Dem. Rep.Congo, Rep.Costa RicaCote d'IvoireCroatiaCubaCyprusDenmarkDjiboutiDominicaDominican RepublicEarly-demographic dividendEast Asia & PacificEast Asia & Pacific (excluding high income)East Asia & Pacific (IDA & IBRD countries)EcuadorEgypt, Arab Rep.El SalvadorEquatorial GuineaEritreaEstoniaEthiopiaEuro areaEurope & Central AsiaEurope & Central Asia (excluding high income)Europe & Central Asia (IDA & IBRD countries)European UnionFijiFinlandFragile and conflict affected situationsFranceGabonGambia, TheGeorgiaGhanaGreeceGrenadaGuatemalaGuineaGuinea-BissauGuyanaHaitiHeavily indebted poor countries (HIPC)High incomeHondurasHong Kong SAR, ChinaHungaryIBRD onlyIcelandIDA & IBRD totalIDA blendIDA onlyIDA totalIndiaIndonesiaIran, Islamic Rep.IraqIrelandIsraelItalyJamaicaJapanJordanKazakhstanKenyaKiribatiKorea, Dem. People’s Rep.Korea, Rep.KuwaitKyrgyz RepublicLao PDRLate-demographic dividendLatin America & Caribbean Latin America & Caribbean (excluding high income)Latin America & the Caribbean (IDA & IBRD countries)LatviaLeast developed countries: UN classificationLebanonLesothoLiberiaLibyaLiechtensteinLithuaniaLow & middle incomeLow incomeLower middle incomeLuxembourgMacao SAR, ChinaMacedonia, FYRMadagascarMalawiMaldivesMaliMaltaMarshall IslandsMauritaniaMauritiusMexicoMicronesia, Fed. Sts.Middle East & North AfricaMiddle East & North Africa (excluding high income)Middle East & North Africa (IDA & IBRD countries)Middle incomeMoldovaMongoliaMontenegroMoroccoMozambiqueMyanmarNamibiaNauruNepalNetherlandsNew ZealandNicaraguaNigerNigeriaNorth AmericaNorwayOECD membersOmanOther small statesPacific island small statesPakistanPanamaPapua New GuineaParaguayPeruPhilippinesPolandPortugalPost-demographic dividendPre-demographic dividendPuerto RicoQatarRomaniaRussian FederationRwandaSamoaSan MarinoSao Tome and PrincipeSaudi ArabiaSenegalSerbiaSeychellesSierra LeoneSloveniaSmall statesSolomon IslandsSomaliaSouth AfricaSouth AsiaSouth Asia (IDA & IBRD)South SudanSpainSri LankaSt. Kitts and NevisSt. LuciaSt. Vincent and the GrenadinesSub-Saharan Africa Sub-Saharan Africa (excluding high income)Sub-Saharan Africa (IDA & IBRD countries)SudanSurinameSwazilandSwedenSwitzerlandSyrian Arab RepublicTajikistanTanzaniaThailandTimor-LesteTogoTongaTrinidad and TobagoTunisiaTurkeyTuvaluUgandaUkraineUnited Arab EmiratesUnited KingdomUnited StatesUpper middle incomeUruguayUzbekistanVanuatuVenezuela, RBWest Bank and GazaWorldYemen, Rep.ZambiaZimbabwe Timeline:
This timeline shows a graph from 1971 to 2015 of Latin America & Caribbean . No data until 1970. Number of actual observations by date: 45.
Source name:
World Development Indicators
Source organization:
United Nations Educational, Scientific, and Cultural Organization (UNESCO) Institute for Statistics.
Categories, topics:
Education
Last updated:
apr 23, 2017
Indicators value changes by year
Maximum:
17.185
jan 1, 1971
At the date of observation
Value
Absolute change
Change from previous value
jan 1, 1971
17.185
+17.185
0.0%
jan 1, 1972
16.807
-0.378
-2.2%
jan 1, 1973
16.326
-0.481
-2.86%
jan 1, 1974
15.651
-0.675
-4.13%
jan 1, 1975
15.074
-0.577
-3.69%
jan 1, 1976
14.922
-0.153
-1.01%
jan 1, 1977
14.272
-0.65
-4.36%
jan 1, 1978
13.327
-0.945
-6.62%
jan 1, 1979
12.809
-0.518
-3.88%
jan 1, 1980
11.399
-1.411
-11.01%
jan 1, 1981
11.156
-0.242
-2.13%
jan 1, 1982
10.189
-0.967
-8.67%
jan 1, 1983
10.199
+0.009
0.09%
jan 1, 1984
10.14
-0.059
-0.58%
jan 1, 1985
10.157
+0.018
0.17%
jan 1, 1986
9.777
-0.38
-3.75%
jan 1, 1987
9.766
-0.011
-0.11%
jan 1, 1988
9.516
-0.25
-2.56%
jan 1, 1989
9.651
+0.135
1.42%
jan 1, 1990
10.233
+0.582
6.03%
jan 1, 1991
9.638
-0.595
-5.82%
jan 1, 1992
9.26
-0.378
-3.92%
jan 1, 1993
8.451
-0.809
-8.74%
jan 1, 1994
8.167
-0.284
-3.36%
jan 1, 1995
8.567
+0.4
4.9%
jan 1, 1996
8.572
+0.005
0.05%
jan 1, 1997
8.244
-0.328
-3.83%
jan 1, 1998
7.939
-0.305
-3.7%
jan 1, 1999
6.289
-1.65
-20.78%
jan 1, 2000
5.147
-1.142
-18.16%
jan 1, 2001
4.382
-0.764
-14.85%
jan 1, 2002
4.364
-0.018
-0.42%
jan 1, 2003
4.424
+0.06
1.37%
jan 1, 2004
5.419
+0.995
22.5%
jan 1, 2005
4.931
-0.488
-9.01%
jan 1, 2006
4.414
-0.517
-10.49%
jan 1, 2007
4.945
+0.531
12.03%
jan 1, 2008
5.394
+0.449
9.09%
jan 1, 2009
4.616
-0.778
-14.43%
jan 1, 2010
4.257
-0.359
-7.78%
jan 1, 2011
4.181
-0.076
-1.78%
jan 1, 2012
4.364
+0.183
4.39%
jan 1, 2013
4.691
+0.327
7.5%
jan 1, 2014
5.595
+0.904
19.27%
jan 1, 2015
5.802
+0.206
3.69%
Ranking of countries by current statistics by years


Comments: