29
/
en
AIzaSyAYiBZKx7MnpbEhh9jyipgxe19OcubqV5w
April 1, 2024
72764
Australia
AUS
true
2
1
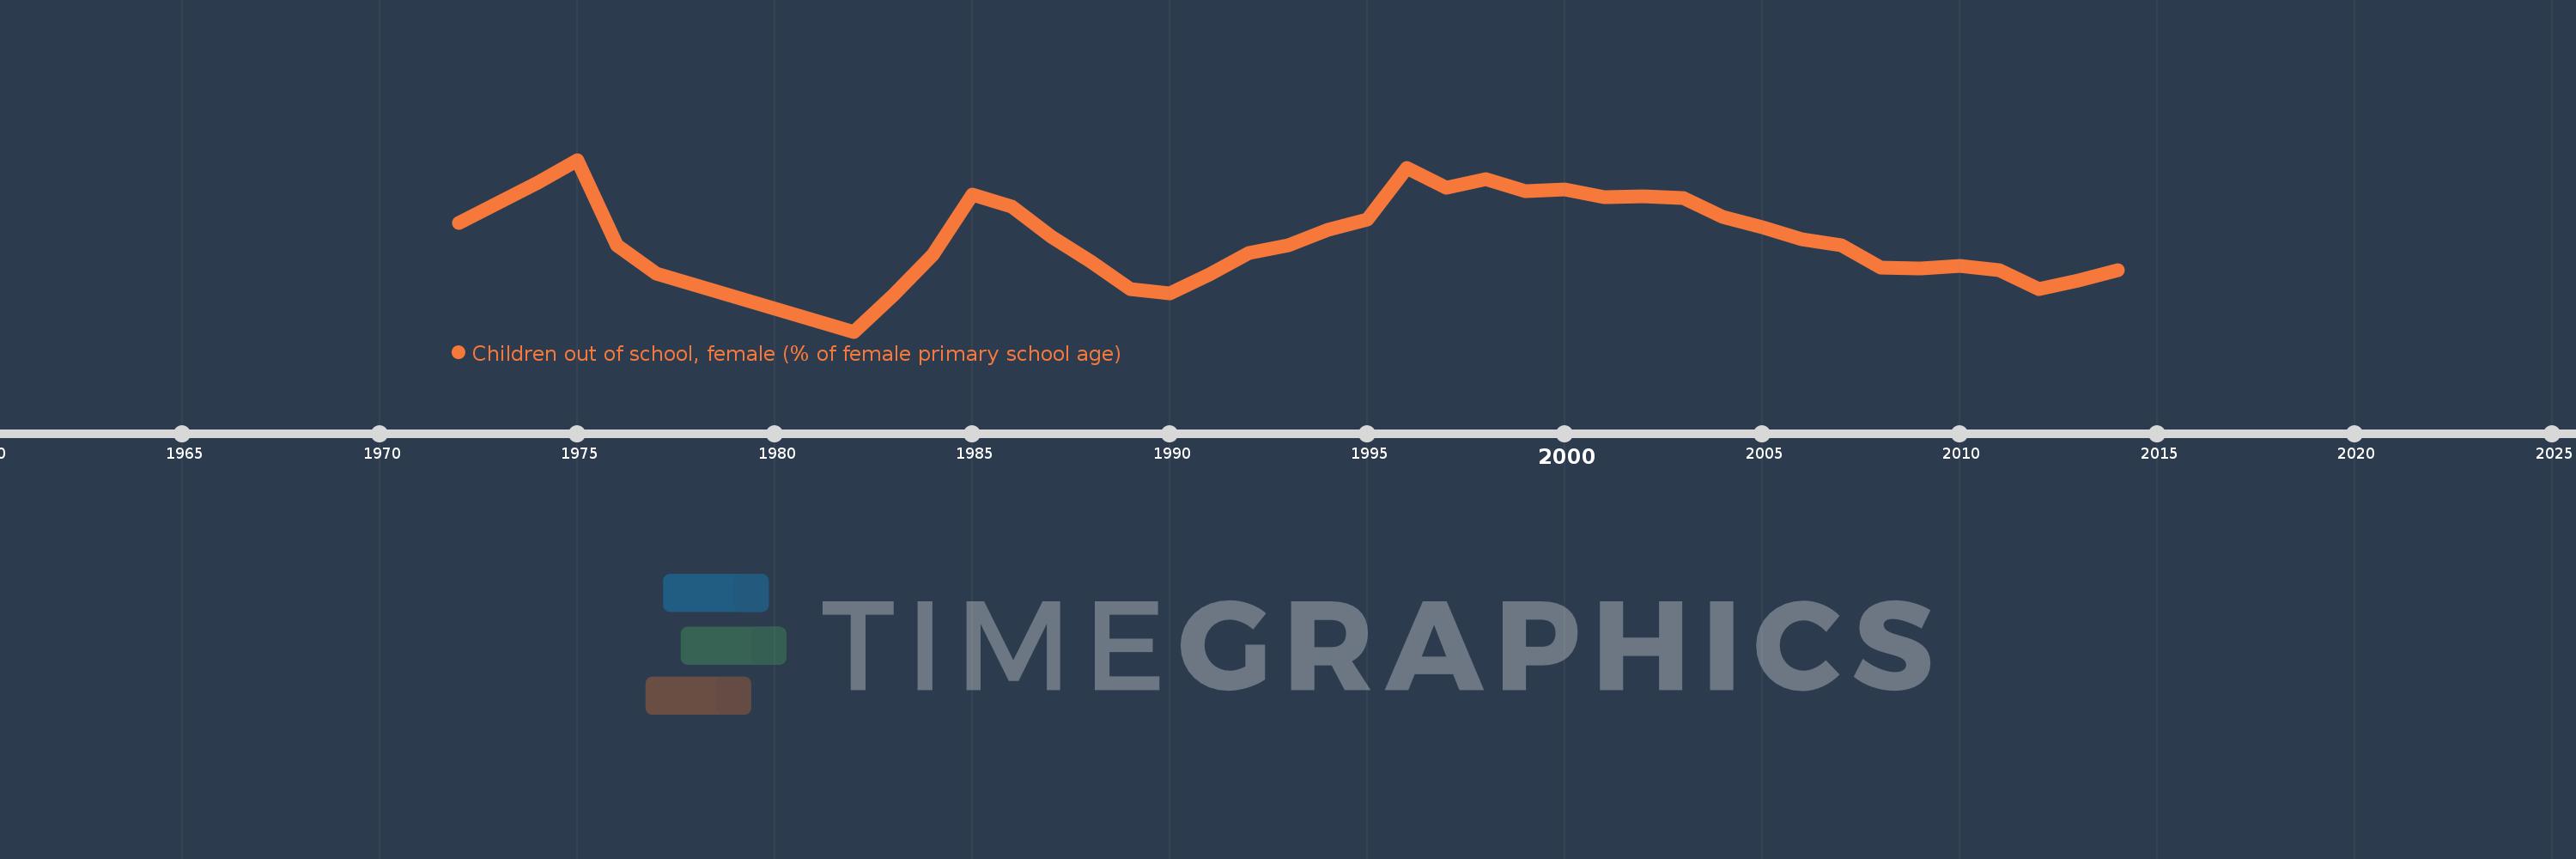
Children out of school, female (% of female primary school age)
2014,2013,2012,2011,2010,2009,2008,2007,2006,2005,2004,2003,2002,2001,2000,1999,1998,1997,1996,1995,1994,1993,1992,1991,1990,1989,1988,1987,1986,1985,1984,1983,1982,1977,1976,1975,1974,1972
This statistics in other country:
AfghanistanAlbaniaAlgeriaAngolaAntigua and BarbudaArab WorldArgentinaArmeniaArubaAustraliaAustriaAzerbaijanBahamas, TheBahrainBangladeshBarbadosBelarusBelgiumBelizeBeninBermudaBhutanBoliviaBosnia and HerzegovinaBotswanaBrazilBrunei DarussalamBulgariaBurkina FasoBurundiCabo VerdeCambodiaCameroonCanadaCaribbean small statesCentral African RepublicCentral Europe and the BalticsChadChileChinaColombiaComorosCongo, Dem. Rep.Congo, Rep.Costa RicaCote d'IvoireCroatiaCubaCyprusDenmarkDjiboutiDominicaDominican RepublicEarly-demographic dividendEast Asia & PacificEast Asia & Pacific (excluding high income)East Asia & Pacific (IDA & IBRD countries)EcuadorEgypt, Arab Rep.El SalvadorEquatorial GuineaEritreaEstoniaEthiopiaEuro areaEurope & Central AsiaEurope & Central Asia (excluding high income)Europe & Central Asia (IDA & IBRD countries)European UnionFijiFinlandFragile and conflict affected situationsFranceGabonGambia, TheGeorgiaGhanaGreeceGrenadaGuatemalaGuineaGuinea-BissauGuyanaHaitiHeavily indebted poor countries (HIPC)High incomeHondurasHong Kong SAR, ChinaHungaryIBRD onlyIcelandIDA & IBRD totalIDA blendIDA onlyIDA totalIndiaIndonesiaIran, Islamic Rep.IraqIrelandIsraelItalyJamaicaJapanJordanKazakhstanKenyaKiribatiKorea, Dem. People’s Rep.Korea, Rep.KuwaitKyrgyz RepublicLao PDRLate-demographic dividendLatin America & Caribbean Latin America & Caribbean (excluding high income)Latin America & the Caribbean (IDA & IBRD countries)LatviaLeast developed countries: UN classificationLebanonLesothoLiberiaLibyaLiechtensteinLithuaniaLow & middle incomeLow incomeLower middle incomeLuxembourgMacao SAR, ChinaMacedonia, FYRMadagascarMalawiMaldivesMaliMaltaMarshall IslandsMauritaniaMauritiusMexicoMicronesia, Fed. Sts.Middle East & North AfricaMiddle East & North Africa (excluding high income)Middle East & North Africa (IDA & IBRD countries)Middle incomeMoldovaMongoliaMontenegroMoroccoMozambiqueMyanmarNamibiaNauruNepalNetherlandsNew ZealandNicaraguaNigerNigeriaNorth AmericaNorwayOECD membersOmanOther small statesPacific island small statesPakistanPanamaPapua New GuineaParaguayPeruPhilippinesPolandPortugalPost-demographic dividendPre-demographic dividendPuerto RicoQatarRomaniaRussian FederationRwandaSamoaSan MarinoSao Tome and PrincipeSaudi ArabiaSenegalSerbiaSeychellesSierra LeoneSloveniaSmall statesSolomon IslandsSomaliaSouth AfricaSouth AsiaSouth Asia (IDA & IBRD)South SudanSpainSri LankaSt. Kitts and NevisSt. LuciaSt. Vincent and the GrenadinesSub-Saharan Africa Sub-Saharan Africa (excluding high income)Sub-Saharan Africa (IDA & IBRD countries)SudanSurinameSwazilandSwedenSwitzerlandSyrian Arab RepublicTajikistanTanzaniaThailandTimor-LesteTogoTongaTrinidad and TobagoTunisiaTurkeyTuvaluUgandaUkraineUnited Arab EmiratesUnited KingdomUnited StatesUpper middle incomeUruguayUzbekistanVanuatuVenezuela, RBWest Bank and GazaWorldYemen, Rep.ZambiaZimbabwe Timeline:
This timeline shows a graph from 1972 to 2014 of Australia. No data until 1971. Number of actual observations by date: 38.
Source name:
World Development Indicators
Source organization:
United Nations Educational, Scientific, and Cultural Organization (UNESCO) Institute for Statistics.
Categories, topics:
Education
Last updated:
apr 23, 2017
Indicators value changes by year
At the date of observation
Value
Absolute change
Change from previous value
jan 1, 1972
3.681
+3.681
0.0%
jan 1, 1974
4.789
+1.107
30.08%
jan 1, 1975
5.432
+0.643
13.43%
jan 1, 1976
3.06
-2.372
-43.67%
jan 1, 1977
2.268
-0.792
-25.87%
jan 1, 1982
0.663
-1.605
-70.76%
jan 1, 1983
1.67
+1.007
151.87%
jan 1, 1984
2.791
+1.121
67.1%
jan 1, 1985
4.461
+1.67
59.84%
jan 1, 1986
4.124
-0.337
-7.56%
jan 1, 1987
3.293
-0.831
-20.15%
jan 1, 1988
2.608
-0.685
-20.81%
jan 1, 1989
1.848
-0.76
-29.15%
jan 1, 1990
1.731
-0.117
-6.33%
jan 1, 1991
2.242
+0.512
29.57%
jan 1, 1992
2.838
+0.595
26.55%
jan 1, 1993
3.068
+0.23
8.1%
jan 1, 1994
3.496
+0.429
13.98%
jan 1, 1995
3.772
+0.276
7.89%
jan 1, 1996
5.198
+1.426
37.81%
jan 1, 1997
4.664
-0.534
-10.27%
jan 1, 1998
4.886
+0.222
4.75%
jan 1, 1999
4.573
-0.313
-6.42%
jan 1, 2000
4.61
+0.037
0.81%
jan 1, 2001
4.4
-0.21
-4.56%
jan 1, 2002
4.409
+0.009
0.2%
jan 1, 2003
4.373
-0.036
-0.82%
jan 1, 2004
3.84
-0.532
-12.17%
jan 1, 2005
3.571
-0.269
-7.0%
jan 1, 2006
3.233
-0.339
-9.48%
jan 1, 2007
3.049
-0.184
-5.69%
jan 1, 2008
2.447
-0.602
-19.74%
jan 1, 2009
2.404
-0.042
-1.73%
jan 1, 2010
2.486
+0.082
3.4%
jan 1, 2011
2.37
-0.116
-4.66%
jan 1, 2012
1.849
-0.521
-22.0%
jan 1, 2013
2.079
+0.23
12.42%
jan 1, 2014
2.361
+0.282
13.57%
Ranking of countries by current statistics by years


Comments: