29
/
en
AIzaSyAYiBZKx7MnpbEhh9jyipgxe19OcubqV5w
April 1, 2024
92775
Brunei Darussalam
BRN
true
2
1
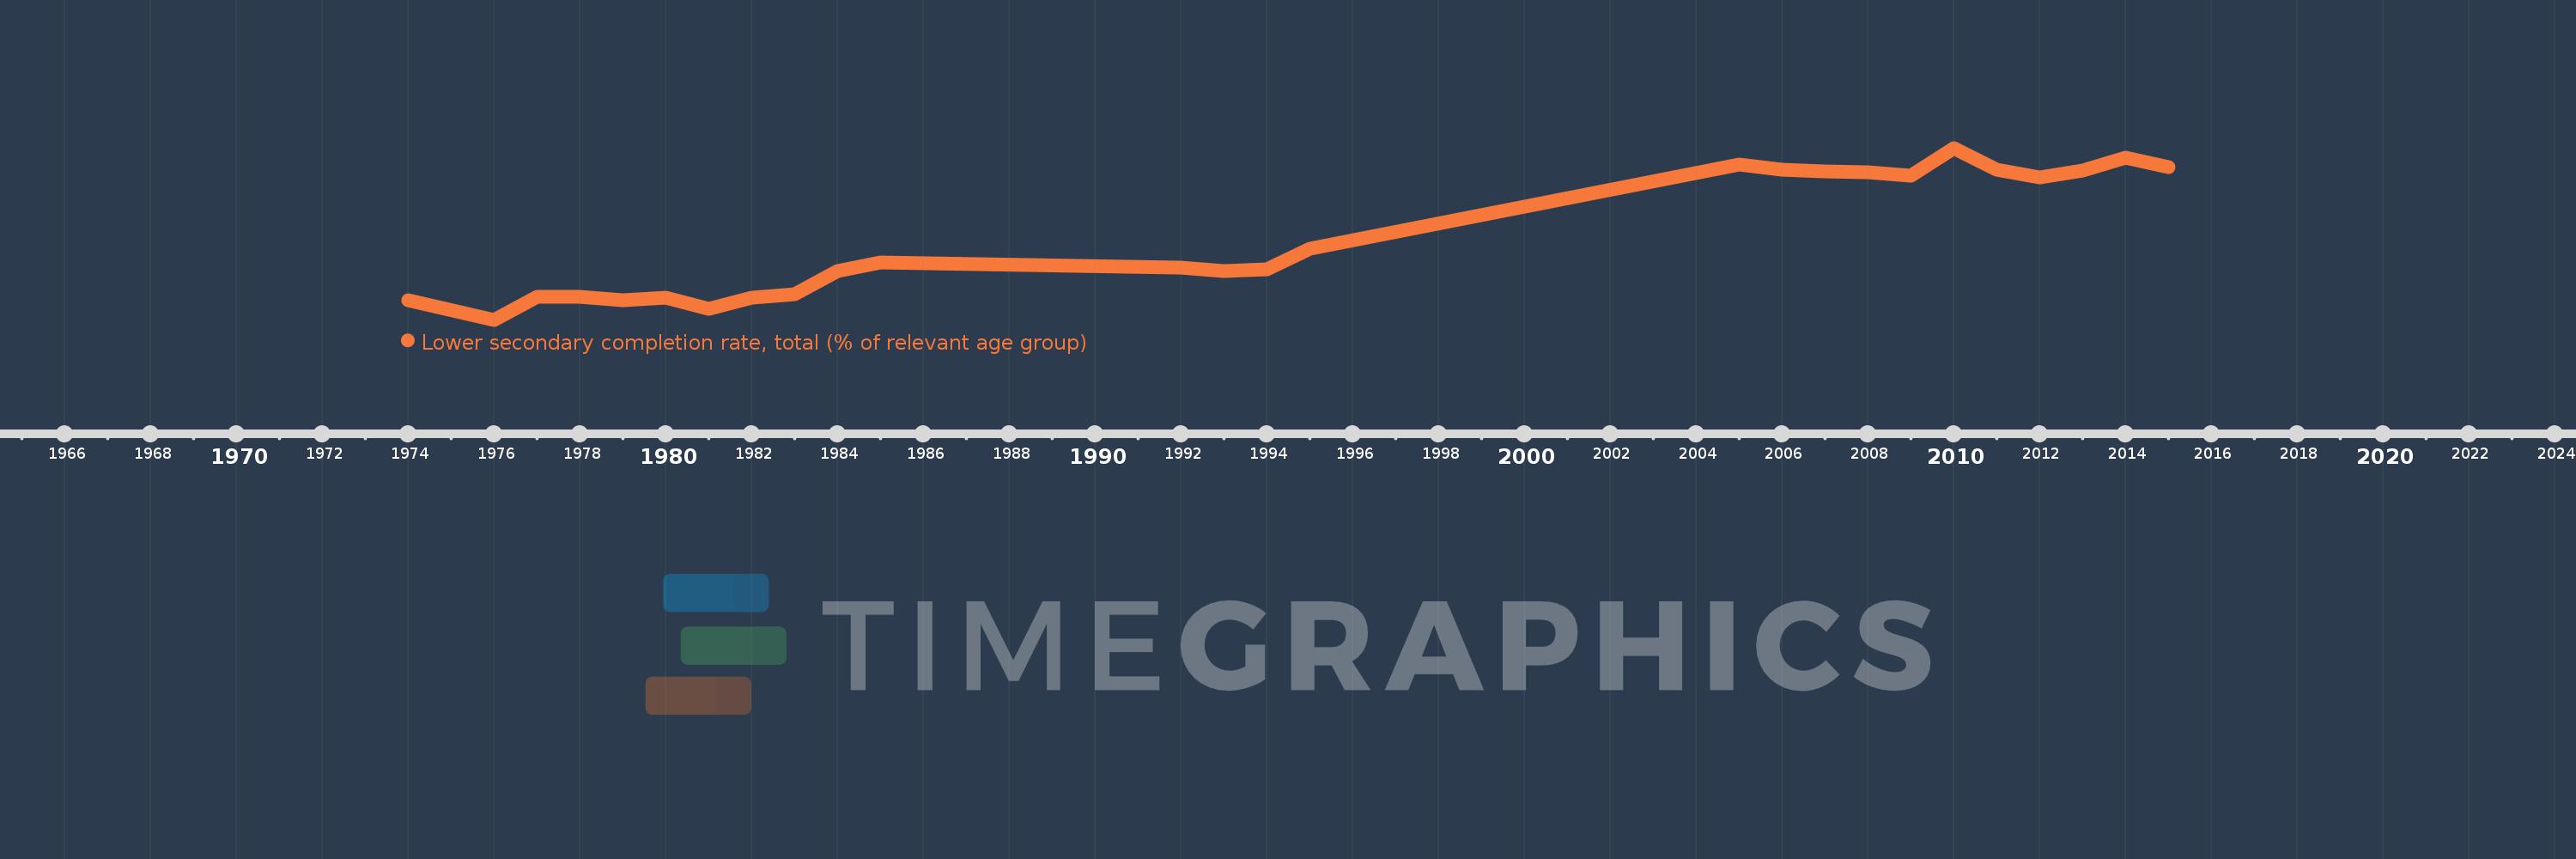
Lower secondary completion rate, total (% of relevant age group)
2015,2014,2013,2012,2011,2010,2009,2008,2007,2006,2005,1995,1994,1993,1992,1985,1984,1983,1982,1981,1980,1979,1978,1977,1976,1974
This statistics in other country:
AfghanistanAlbaniaAlgeriaAngolaAntigua and BarbudaArab WorldArgentinaArmeniaArubaAustriaAzerbaijanBahamas, TheBahrainBangladeshBarbadosBelarusBelgiumBelizeBeninBermudaBhutanBoliviaBosnia and HerzegovinaBotswanaBrazilBritish Virgin IslandsBrunei DarussalamBulgariaBurkina FasoBurundiCabo VerdeCambodiaCameroonCaribbean small statesCentral African RepublicCentral Europe and the BalticsChadChileChinaColombiaComorosCongo, Dem. Rep.Congo, Rep.Costa RicaCote d'IvoireCroatiaCubaCyprusCzech RepublicDenmarkDjiboutiDominicaDominican RepublicEarly-demographic dividendEast Asia & PacificEast Asia & Pacific (excluding high income)East Asia & Pacific (IDA & IBRD countries)EcuadorEgypt, Arab Rep.El SalvadorEquatorial GuineaEritreaEstoniaEthiopiaEuro areaEurope & Central AsiaEurope & Central Asia (excluding high income)Europe & Central Asia (IDA & IBRD countries)European UnionFijiFinlandFragile and conflict affected situationsFranceGabonGambia, TheGeorgiaGermanyGhanaGreeceGrenadaGuatemalaGuineaGuinea-BissauGuyanaHaitiHeavily indebted poor countries (HIPC)High incomeHondurasHong Kong SAR, ChinaHungaryIBRD onlyIcelandIDA & IBRD totalIDA blendIDA onlyIDA totalIndiaIndonesiaIran, Islamic Rep.IraqIrelandIsraelItalyJamaicaJapanJordanKazakhstanKenyaKiribatiKorea, Dem. People’s Rep.Korea, Rep.KuwaitKyrgyz RepublicLao PDRLate-demographic dividendLatin America & Caribbean Latin America & Caribbean (excluding high income)Latin America & the Caribbean (IDA & IBRD countries)LatviaLeast developed countries: UN classificationLebanonLesothoLiberiaLiechtensteinLithuaniaLow & middle incomeLow incomeLower middle incomeLuxembourgMacao SAR, ChinaMacedonia, FYRMadagascarMalawiMalaysiaMaldivesMaliMaltaMarshall IslandsMauritaniaMauritiusMexicoMiddle East & North AfricaMiddle East & North Africa (excluding high income)Middle East & North Africa (IDA & IBRD countries)Middle incomeMoldovaMongoliaMontenegroMoroccoMozambiqueMyanmarNamibiaNauruNepalNetherlandsNicaraguaNigerNorwayOECD membersOmanOther small statesPacific island small statesPakistanPalauPanamaPapua New GuineaParaguayPeruPhilippinesPolandPortugalPost-demographic dividendPre-demographic dividendQatarRomaniaRussian FederationRwandaSamoaSan MarinoSao Tome and PrincipeSaudi ArabiaSenegalSerbiaSeychellesSierra LeoneSlovak RepublicSloveniaSmall statesSolomon IslandsSouth AfricaSouth AsiaSouth Asia (IDA & IBRD)South SudanSpainSri LankaSt. Kitts and NevisSt. LuciaSt. Vincent and the GrenadinesSub-Saharan Africa Sub-Saharan Africa (excluding high income)Sub-Saharan Africa (IDA & IBRD countries)SudanSurinameSwazilandSwedenSwitzerlandSyrian Arab RepublicTajikistanTanzaniaThailandTimor-LesteTogoTongaTrinidad and TobagoTunisiaTurkeyTuvaluUgandaUkraineUnited Arab EmiratesUpper middle incomeUruguayUzbekistanVanuatuVenezuela, RBVietnamWest Bank and GazaWorldYemen, Rep.ZambiaZimbabwe Timeline:
This timeline shows a graph from 1974 to 2015 of Brunei Darussalam. No data until 1973. Number of actual observations by date: 26.
Source name:
World Development Indicators
Source organization:
United Nations Educational, Scientific, and Cultural Organization (UNESCO) Institute for Statistics.
Categories, topics:
Education
Last updated:
apr 23, 2017
Indicators value changes by year
Minimum:
30.604
jan 1, 1976
Maximum:
115.336
jan 1, 2010
At the date of observation
Value
Absolute change
Change from previous value
jan 1, 1974
40.337
+40.337
0.0%
jan 1, 1976
30.604
-9.733
-24.13%
jan 1, 1977
41.802
+11.197
36.59%
jan 1, 1978
41.763
-0.039
-0.09%
jan 1, 1979
40.081
-1.682
-4.03%
jan 1, 1980
41.482
+1.401
3.5%
jan 1, 1981
35.936
-5.546
-13.37%
jan 1, 1982
41.395
+5.459
15.19%
jan 1, 1983
43.254
+1.86
4.49%
jan 1, 1984
54.836
+11.581
26.77%
jan 1, 1985
58.797
+3.962
7.22%
jan 1, 1992
56.243
-2.554
-4.34%
jan 1, 1993
54.426
-1.817
-3.23%
jan 1, 1994
55.335
+0.909
1.67%
jan 1, 1995
65.751
+10.417
18.82%
jan 1, 2005
107.344
+41.593
63.26%
jan 1, 2006
104.51
-2.834
-2.64%
jan 1, 2007
103.748
-0.762
-0.73%
jan 1, 2008
103.228
-0.52
-0.5%
jan 1, 2009
101.844
-1.384
-1.34%
jan 1, 2010
115.336
+13.492
13.25%
jan 1, 2011
104.52
-10.816
-9.38%
jan 1, 2012
100.947
-3.573
-3.42%
jan 1, 2013
104.244
+3.296
3.27%
jan 1, 2014
110.459
+6.215
5.96%
jan 1, 2015
105.695
-4.764
-4.31%
Ranking of countries by current statistics by years


Comments: