29
/
en
AIzaSyAYiBZKx7MnpbEhh9jyipgxe19OcubqV5w
April 1, 2024
236025
Senegal
SEN
true
2
1
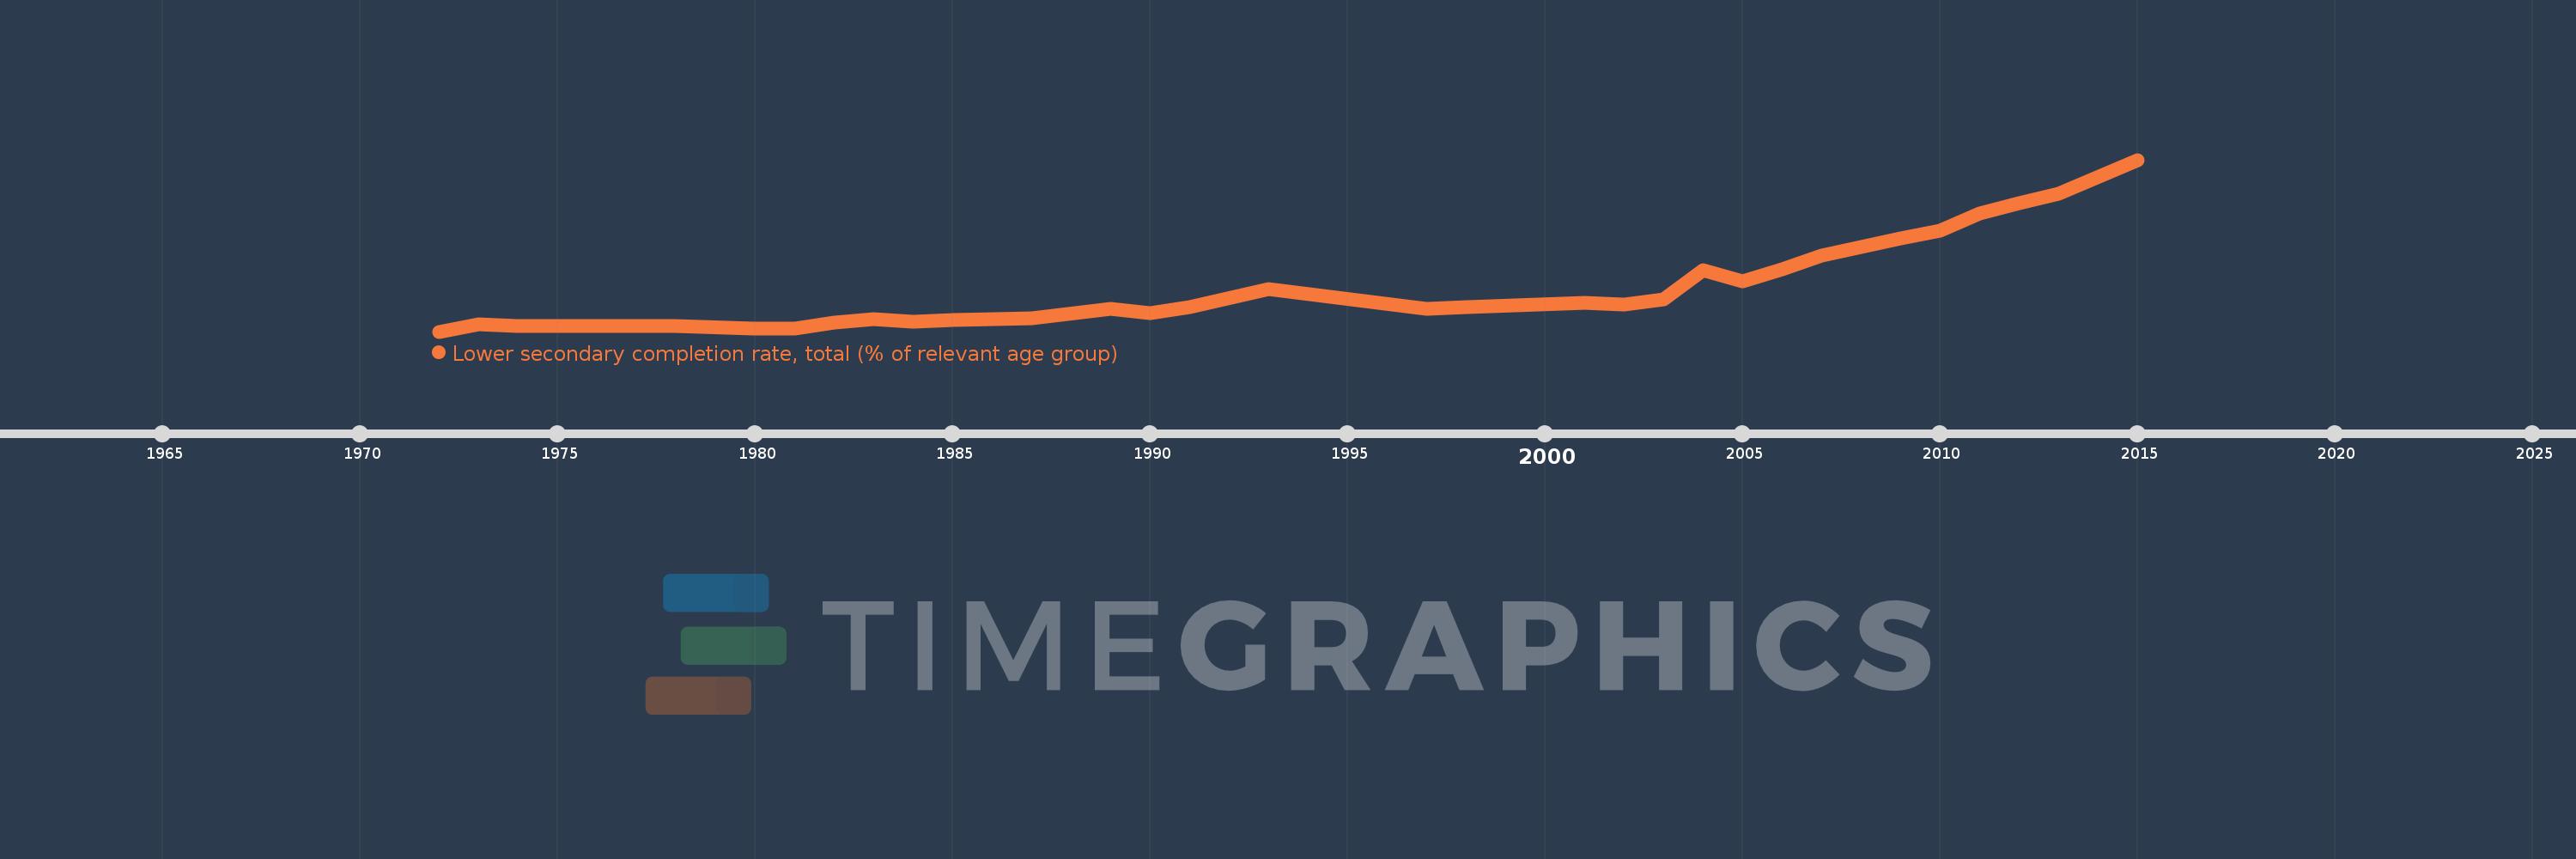
Lower secondary completion rate, total (% of relevant age group)
2015,2013,2012,2011,2010,2009,2007,2006,2005,2004,2003,2002,2001,1998,1997,1993,1991,1990,1989,1987,1985,1984,1983,1982,1981,1980,1978,1974,1973,1972
This statistics in other country:
AfghanistanAlbaniaAlgeriaAngolaAntigua and BarbudaArab WorldArgentinaArmeniaArubaAustriaAzerbaijanBahamas, TheBahrainBangladeshBarbadosBelarusBelgiumBelizeBeninBermudaBhutanBoliviaBosnia and HerzegovinaBotswanaBrazilBritish Virgin IslandsBrunei DarussalamBulgariaBurkina FasoBurundiCabo VerdeCambodiaCameroonCaribbean small statesCentral African RepublicCentral Europe and the BalticsChadChileChinaColombiaComorosCongo, Dem. Rep.Congo, Rep.Costa RicaCote d'IvoireCroatiaCubaCyprusCzech RepublicDenmarkDjiboutiDominicaDominican RepublicEarly-demographic dividendEast Asia & PacificEast Asia & Pacific (excluding high income)East Asia & Pacific (IDA & IBRD countries)EcuadorEgypt, Arab Rep.El SalvadorEquatorial GuineaEritreaEstoniaEthiopiaEuro areaEurope & Central AsiaEurope & Central Asia (excluding high income)Europe & Central Asia (IDA & IBRD countries)European UnionFijiFinlandFragile and conflict affected situationsFranceGabonGambia, TheGeorgiaGermanyGhanaGreeceGrenadaGuatemalaGuineaGuinea-BissauGuyanaHaitiHeavily indebted poor countries (HIPC)High incomeHondurasHong Kong SAR, ChinaHungaryIBRD onlyIcelandIDA & IBRD totalIDA blendIDA onlyIDA totalIndiaIndonesiaIran, Islamic Rep.IraqIrelandIsraelItalyJamaicaJapanJordanKazakhstanKenyaKiribatiKorea, Dem. People’s Rep.Korea, Rep.KuwaitKyrgyz RepublicLao PDRLate-demographic dividendLatin America & Caribbean Latin America & Caribbean (excluding high income)Latin America & the Caribbean (IDA & IBRD countries)LatviaLeast developed countries: UN classificationLebanonLesothoLiberiaLiechtensteinLithuaniaLow & middle incomeLow incomeLower middle incomeLuxembourgMacao SAR, ChinaMacedonia, FYRMadagascarMalawiMalaysiaMaldivesMaliMaltaMarshall IslandsMauritaniaMauritiusMexicoMiddle East & North AfricaMiddle East & North Africa (excluding high income)Middle East & North Africa (IDA & IBRD countries)Middle incomeMoldovaMongoliaMontenegroMoroccoMozambiqueMyanmarNamibiaNauruNepalNetherlandsNicaraguaNigerNorwayOECD membersOmanOther small statesPacific island small statesPakistanPalauPanamaPapua New GuineaParaguayPeruPhilippinesPolandPortugalPost-demographic dividendPre-demographic dividendQatarRomaniaRussian FederationRwandaSamoaSan MarinoSao Tome and PrincipeSaudi ArabiaSenegalSerbiaSeychellesSierra LeoneSlovak RepublicSloveniaSmall statesSolomon IslandsSouth AfricaSouth AsiaSouth Asia (IDA & IBRD)South SudanSpainSri LankaSt. Kitts and NevisSt. LuciaSt. Vincent and the GrenadinesSub-Saharan Africa Sub-Saharan Africa (excluding high income)Sub-Saharan Africa (IDA & IBRD countries)SudanSurinameSwazilandSwedenSwitzerlandSyrian Arab RepublicTajikistanTanzaniaThailandTimor-LesteTogoTongaTrinidad and TobagoTunisiaTurkeyTuvaluUgandaUkraineUnited Arab EmiratesUpper middle incomeUruguayUzbekistanVanuatuVenezuela, RBVietnamWest Bank and GazaWorldYemen, Rep.ZambiaZimbabwe Timeline:
This timeline shows a graph from 1972 to 2015 of Senegal. No data until 1971. Number of actual observations by date: 30.
Source name:
World Development Indicators
Source organization:
United Nations Educational, Scientific, and Cultural Organization (UNESCO) Institute for Statistics.
Categories, topics:
Education
Last updated:
apr 23, 2017
Indicators value changes by year
Maximum:
40.288
jan 1, 2015
At the date of observation
Value
Absolute change
Change from previous value
jan 1, 1972
8.466
+8.466
0.0%
jan 1, 1973
9.777
+1.311
15.49%
jan 1, 1974
9.51
-0.267
-2.73%
jan 1, 1978
9.491
-0.019
-0.2%
jan 1, 1980
9.028
-0.463
-4.88%
jan 1, 1981
9.021
-0.006
-0.07%
jan 1, 1982
10.155
+1.134
12.57%
jan 1, 1983
10.807
+0.651
6.41%
jan 1, 1984
10.339
-0.467
-4.32%
jan 1, 1985
10.663
+0.324
3.14%
jan 1, 1987
10.918
+0.255
2.39%
jan 1, 1989
12.603
+1.685
15.43%
jan 1, 1990
11.879
-0.724
-5.74%
jan 1, 1991
12.936
+1.057
8.9%
jan 1, 1993
16.288
+3.352
25.91%
jan 1, 1997
12.683
-3.605
-22.13%
jan 1, 1998
13.043
+0.36
2.84%
jan 1, 2001
13.74
+0.697
5.35%
jan 1, 2002
13.498
-0.242
-1.76%
jan 1, 2003
14.478
+0.98
7.26%
jan 1, 2004
19.832
+5.354
36.98%
jan 1, 2005
17.794
-2.038
-10.28%
jan 1, 2006
19.955
+2.161
12.14%
jan 1, 2007
22.586
+2.631
13.19%
jan 1, 2009
25.763
+3.177
14.07%
jan 1, 2010
27.083
+1.319
5.12%
jan 1, 2011
30.275
+3.193
11.79%
jan 1, 2012
32.212
+1.936
6.4%
jan 1, 2013
33.997
+1.785
5.54%
jan 1, 2015
40.288
+6.291
18.5%
Ranking of countries by current statistics by years


Comments: