29
/
en
AIzaSyAYiBZKx7MnpbEhh9jyipgxe19OcubqV5w
April 1, 2024
52789
OECD members
OED
false
2
1
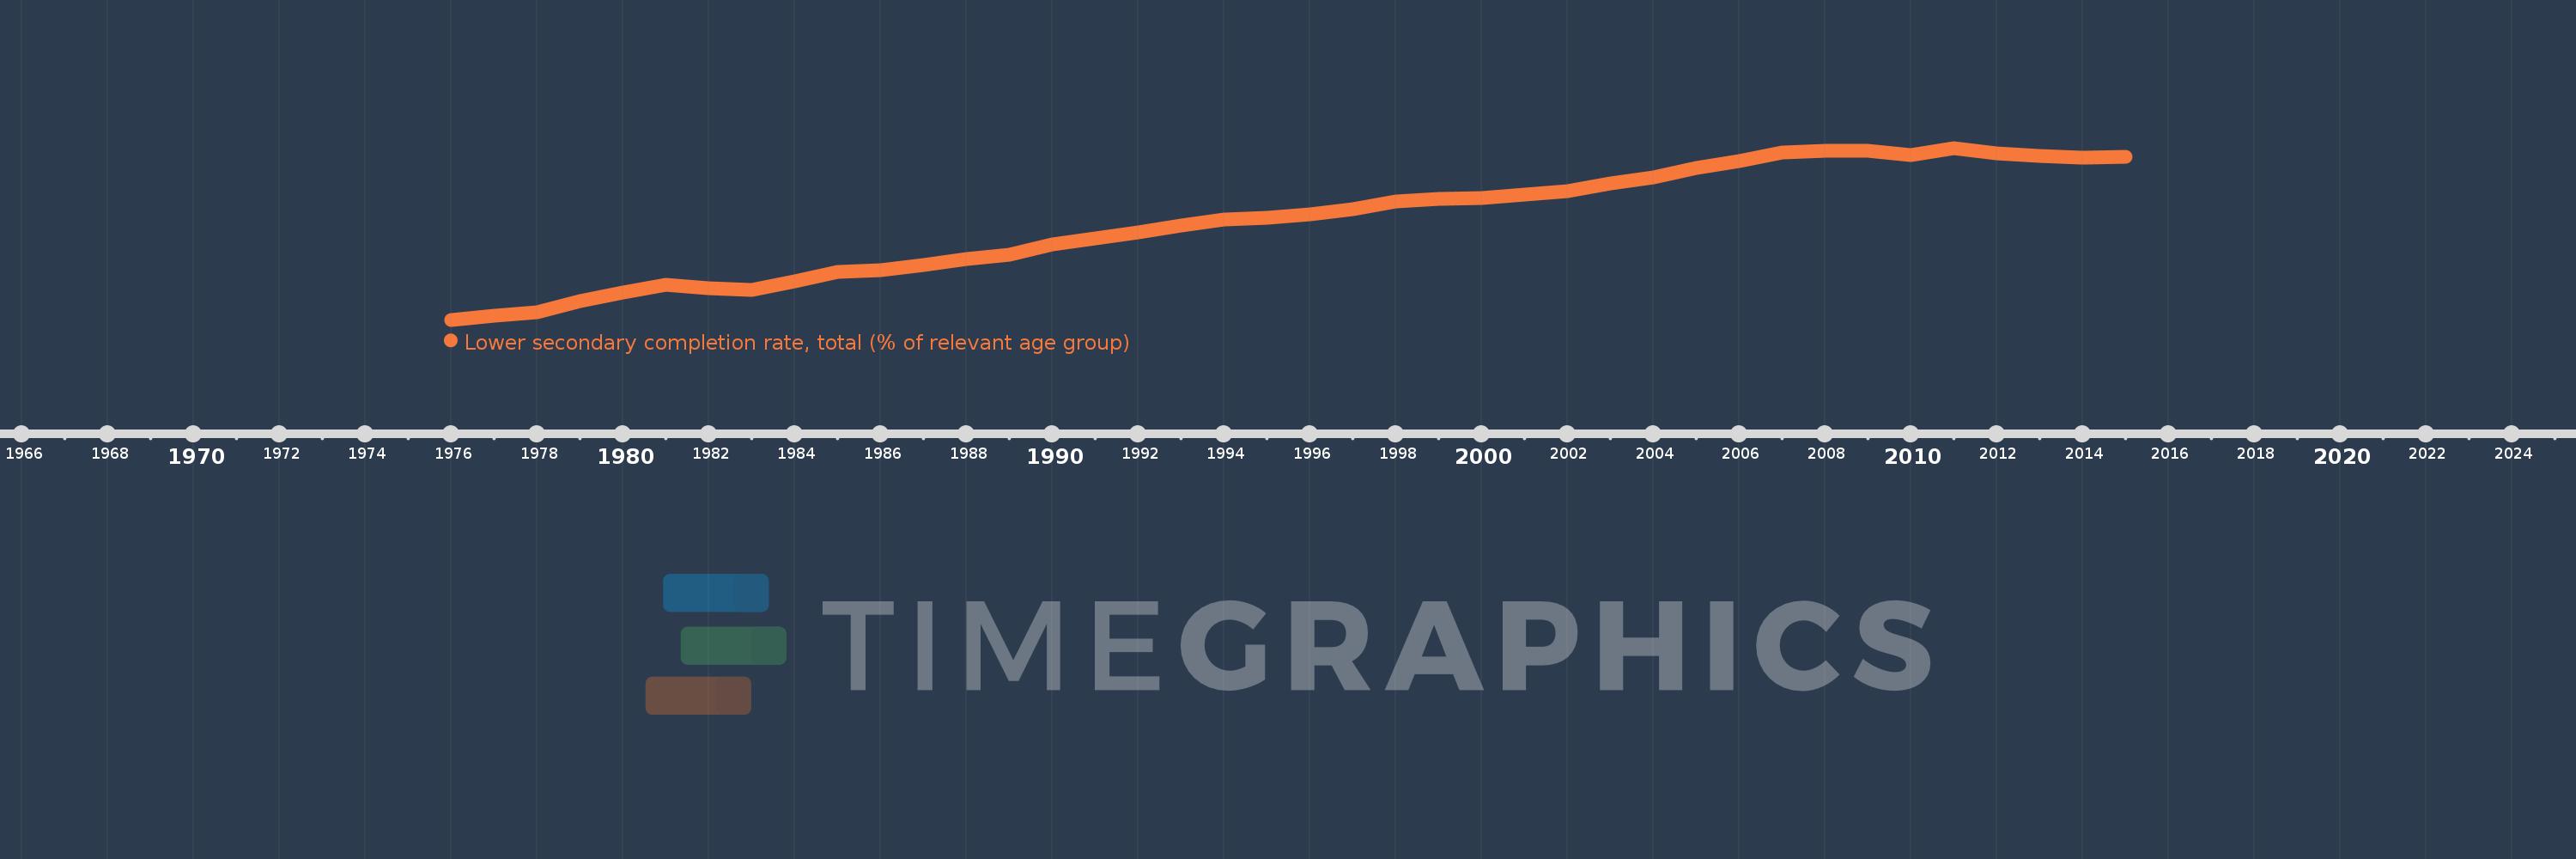
Lower secondary completion rate, total (% of relevant age group)
2015,2014,2013,2012,2011,2010,2009,2008,2007,2006,2005,2004,2003,2002,2001,2000,1999,1998,1997,1996,1995,1994,1993,1992,1991,1990,1989,1988,1987,1986,1985,1984,1983,1982,1981,1980,1979,1978,1977,1976
This statistics in other country:
AfghanistanAlbaniaAlgeriaAngolaAntigua and BarbudaArab WorldArgentinaArmeniaArubaAustriaAzerbaijanBahamas, TheBahrainBangladeshBarbadosBelarusBelgiumBelizeBeninBermudaBhutanBoliviaBosnia and HerzegovinaBotswanaBrazilBritish Virgin IslandsBrunei DarussalamBulgariaBurkina FasoBurundiCabo VerdeCambodiaCameroonCaribbean small statesCentral African RepublicCentral Europe and the BalticsChadChileChinaColombiaComorosCongo, Dem. Rep.Congo, Rep.Costa RicaCote d'IvoireCroatiaCubaCyprusCzech RepublicDenmarkDjiboutiDominicaDominican RepublicEarly-demographic dividendEast Asia & PacificEast Asia & Pacific (excluding high income)East Asia & Pacific (IDA & IBRD countries)EcuadorEgypt, Arab Rep.El SalvadorEquatorial GuineaEritreaEstoniaEthiopiaEuro areaEurope & Central AsiaEurope & Central Asia (excluding high income)Europe & Central Asia (IDA & IBRD countries)European UnionFijiFinlandFragile and conflict affected situationsFranceGabonGambia, TheGeorgiaGermanyGhanaGreeceGrenadaGuatemalaGuineaGuinea-BissauGuyanaHaitiHeavily indebted poor countries (HIPC)High incomeHondurasHong Kong SAR, ChinaHungaryIBRD onlyIcelandIDA & IBRD totalIDA blendIDA onlyIDA totalIndiaIndonesiaIran, Islamic Rep.IraqIrelandIsraelItalyJamaicaJapanJordanKazakhstanKenyaKiribatiKorea, Dem. People’s Rep.Korea, Rep.KuwaitKyrgyz RepublicLao PDRLate-demographic dividendLatin America & Caribbean Latin America & Caribbean (excluding high income)Latin America & the Caribbean (IDA & IBRD countries)LatviaLeast developed countries: UN classificationLebanonLesothoLiberiaLiechtensteinLithuaniaLow & middle incomeLow incomeLower middle incomeLuxembourgMacao SAR, ChinaMacedonia, FYRMadagascarMalawiMalaysiaMaldivesMaliMaltaMarshall IslandsMauritaniaMauritiusMexicoMiddle East & North AfricaMiddle East & North Africa (excluding high income)Middle East & North Africa (IDA & IBRD countries)Middle incomeMoldovaMongoliaMontenegroMoroccoMozambiqueMyanmarNamibiaNauruNepalNetherlandsNicaraguaNigerNorwayOECD membersOmanOther small statesPacific island small statesPakistanPalauPanamaPapua New GuineaParaguayPeruPhilippinesPolandPortugalPost-demographic dividendPre-demographic dividendQatarRomaniaRussian FederationRwandaSamoaSan MarinoSao Tome and PrincipeSaudi ArabiaSenegalSerbiaSeychellesSierra LeoneSlovak RepublicSloveniaSmall statesSolomon IslandsSouth AfricaSouth AsiaSouth Asia (IDA & IBRD)South SudanSpainSri LankaSt. Kitts and NevisSt. LuciaSt. Vincent and the GrenadinesSub-Saharan Africa Sub-Saharan Africa (excluding high income)Sub-Saharan Africa (IDA & IBRD countries)SudanSurinameSwazilandSwedenSwitzerlandSyrian Arab RepublicTajikistanTanzaniaThailandTimor-LesteTogoTongaTrinidad and TobagoTunisiaTurkeyTuvaluUgandaUkraineUnited Arab EmiratesUpper middle incomeUruguayUzbekistanVanuatuVenezuela, RBVietnamWest Bank and GazaWorldYemen, Rep.ZambiaZimbabwe Timeline:
This timeline shows a graph from 1976 to 2015 of OECD members. No data until 1975. Number of actual observations by date: 40.
Source name:
World Development Indicators
Source organization:
United Nations Educational, Scientific, and Cultural Organization (UNESCO) Institute for Statistics.
Categories, topics:
Education
Last updated:
apr 23, 2017
Indicators value changes by year
Minimum:
69.885
jan 1, 1976
Maximum:
92.006
jan 1, 2011
At the date of observation
Value
Absolute change
Change from previous value
jan 1, 1976
69.885
+69.885
0.0%
jan 1, 1977
70.38
+0.495
0.71%
jan 1, 1978
70.887
+0.507
0.72%
jan 1, 1979
72.325
+1.438
2.03%
jan 1, 1980
73.389
+1.064
1.47%
jan 1, 1981
74.402
+1.013
1.38%
jan 1, 1982
73.968
-0.434
-0.58%
jan 1, 1983
73.724
-0.244
-0.33%
jan 1, 1984
74.878
+1.154
1.57%
jan 1, 1985
76.058
+1.18
1.58%
jan 1, 1986
76.234
+0.176
0.23%
jan 1, 1987
76.933
+0.699
0.92%
jan 1, 1988
77.707
+0.774
1.01%
jan 1, 1989
78.258
+0.551
0.71%
jan 1, 1990
79.601
+1.343
1.72%
jan 1, 1991
80.347
+0.746
0.94%
jan 1, 1992
81.104
+0.756
0.94%
jan 1, 1993
82.032
+0.929
1.15%
jan 1, 1994
82.781
+0.748
0.91%
jan 1, 1995
83.029
+0.248
0.3%
jan 1, 1996
83.406
+0.377
0.45%
jan 1, 1997
84.119
+0.713
0.85%
jan 1, 1998
85.07
+0.951
1.13%
jan 1, 1999
85.489
+0.418
0.49%
jan 1, 2000
85.505
+0.016
0.02%
jan 1, 2001
86.006
+0.501
0.59%
jan 1, 2002
86.466
+0.46
0.54%
jan 1, 2003
87.404
+0.938
1.09%
jan 1, 2004
88.238
+0.834
0.95%
jan 1, 2005
89.394
+1.155
1.31%
jan 1, 2006
90.269
+0.876
0.98%
jan 1, 2007
91.455
+1.185
1.31%
jan 1, 2008
91.637
+0.183
0.2%
jan 1, 2009
91.687
+0.05
0.05%
jan 1, 2010
91.117
-0.571
-0.62%
jan 1, 2011
92.006
+0.889
0.98%
jan 1, 2012
91.316
-0.69
-0.75%
jan 1, 2013
90.992
-0.325
-0.36%
jan 1, 2014
90.716
-0.276
-0.3%
jan 1, 2015
90.852
+0.136
0.15%
Ranking of countries by current statistics by years


Comments: