29
/
en
AIzaSyAYiBZKx7MnpbEhh9jyipgxe19OcubqV5w
April 1, 2024
40076
IDA total
IDA
false
2
1
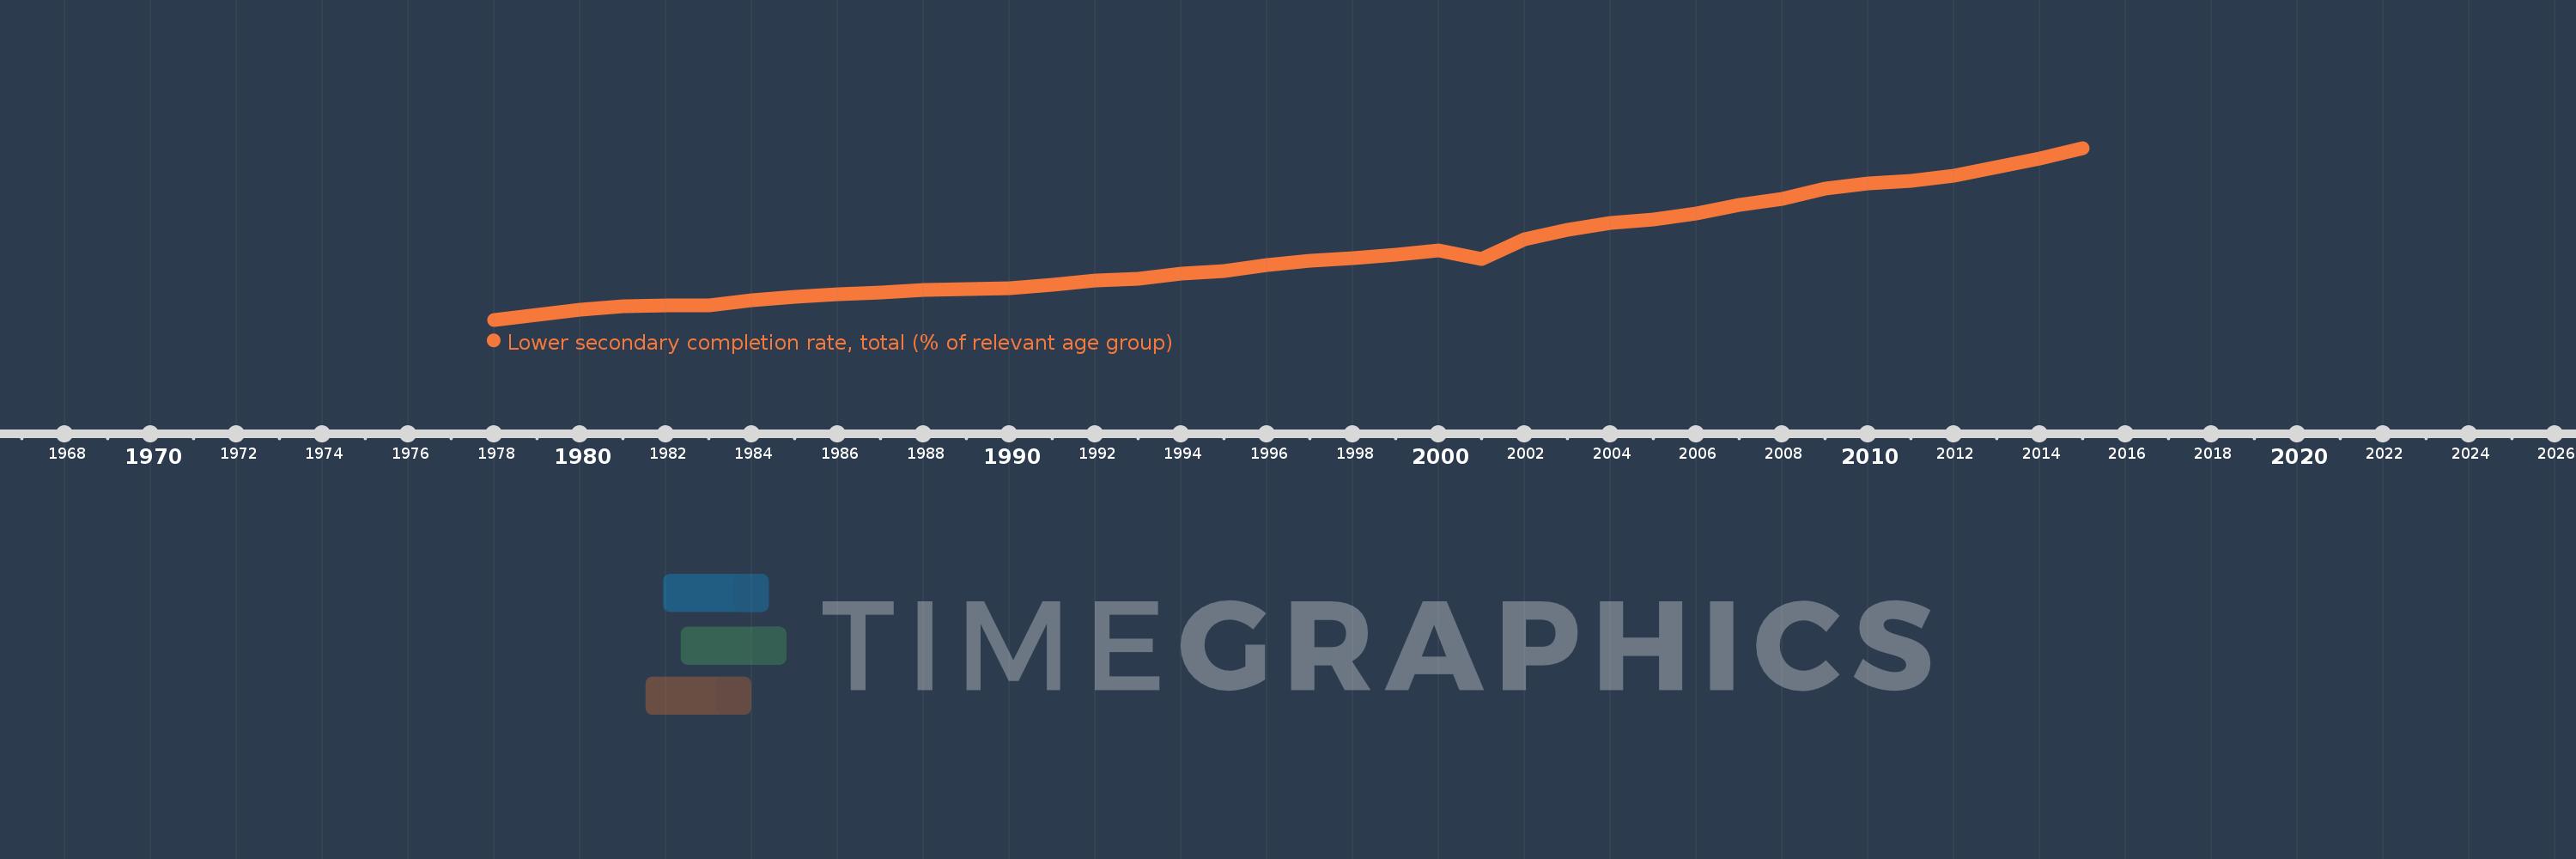
Lower secondary completion rate, total (% of relevant age group)
2015,2014,2013,2012,2011,2010,2009,2008,2007,2006,2005,2004,2003,2002,2001,2000,1999,1998,1997,1996,1995,1994,1993,1992,1991,1990,1989,1988,1987,1986,1985,1984,1983,1982,1981,1980,1979,1978
This statistics in other country:
AfghanistanAlbaniaAlgeriaAngolaAntigua and BarbudaArab WorldArgentinaArmeniaArubaAustriaAzerbaijanBahamas, TheBahrainBangladeshBarbadosBelarusBelgiumBelizeBeninBermudaBhutanBoliviaBosnia and HerzegovinaBotswanaBrazilBritish Virgin IslandsBrunei DarussalamBulgariaBurkina FasoBurundiCabo VerdeCambodiaCameroonCaribbean small statesCentral African RepublicCentral Europe and the BalticsChadChileChinaColombiaComorosCongo, Dem. Rep.Congo, Rep.Costa RicaCote d'IvoireCroatiaCubaCyprusCzech RepublicDenmarkDjiboutiDominicaDominican RepublicEarly-demographic dividendEast Asia & PacificEast Asia & Pacific (excluding high income)East Asia & Pacific (IDA & IBRD countries)EcuadorEgypt, Arab Rep.El SalvadorEquatorial GuineaEritreaEstoniaEthiopiaEuro areaEurope & Central AsiaEurope & Central Asia (excluding high income)Europe & Central Asia (IDA & IBRD countries)European UnionFijiFinlandFragile and conflict affected situationsFranceGabonGambia, TheGeorgiaGermanyGhanaGreeceGrenadaGuatemalaGuineaGuinea-BissauGuyanaHaitiHeavily indebted poor countries (HIPC)High incomeHondurasHong Kong SAR, ChinaHungaryIBRD onlyIcelandIDA & IBRD totalIDA blendIDA onlyIDA totalIndiaIndonesiaIran, Islamic Rep.IraqIrelandIsraelItalyJamaicaJapanJordanKazakhstanKenyaKiribatiKorea, Dem. People’s Rep.Korea, Rep.KuwaitKyrgyz RepublicLao PDRLate-demographic dividendLatin America & Caribbean Latin America & Caribbean (excluding high income)Latin America & the Caribbean (IDA & IBRD countries)LatviaLeast developed countries: UN classificationLebanonLesothoLiberiaLiechtensteinLithuaniaLow & middle incomeLow incomeLower middle incomeLuxembourgMacao SAR, ChinaMacedonia, FYRMadagascarMalawiMalaysiaMaldivesMaliMaltaMarshall IslandsMauritaniaMauritiusMexicoMiddle East & North AfricaMiddle East & North Africa (excluding high income)Middle East & North Africa (IDA & IBRD countries)Middle incomeMoldovaMongoliaMontenegroMoroccoMozambiqueMyanmarNamibiaNauruNepalNetherlandsNicaraguaNigerNorwayOECD membersOmanOther small statesPacific island small statesPakistanPalauPanamaPapua New GuineaParaguayPeruPhilippinesPolandPortugalPost-demographic dividendPre-demographic dividendQatarRomaniaRussian FederationRwandaSamoaSan MarinoSao Tome and PrincipeSaudi ArabiaSenegalSerbiaSeychellesSierra LeoneSlovak RepublicSloveniaSmall statesSolomon IslandsSouth AfricaSouth AsiaSouth Asia (IDA & IBRD)South SudanSpainSri LankaSt. Kitts and NevisSt. LuciaSt. Vincent and the GrenadinesSub-Saharan Africa Sub-Saharan Africa (excluding high income)Sub-Saharan Africa (IDA & IBRD countries)SudanSurinameSwazilandSwedenSwitzerlandSyrian Arab RepublicTajikistanTanzaniaThailandTimor-LesteTogoTongaTrinidad and TobagoTunisiaTurkeyTuvaluUgandaUkraineUnited Arab EmiratesUpper middle incomeUruguayUzbekistanVanuatuVenezuela, RBVietnamWest Bank and GazaWorldYemen, Rep.ZambiaZimbabwe Timeline:
This timeline shows a graph from 1978 to 2015 of IDA total. No data until 1977. Number of actual observations by date: 38.
Source name:
World Development Indicators
Source organization:
United Nations Educational, Scientific, and Cultural Organization (UNESCO) Institute for Statistics.
Categories, topics:
Education
Last updated:
apr 23, 2017
Indicators value changes by year
Minimum:
25.886
jan 1, 1978
Maximum:
50.097
jan 1, 2015
At the date of observation
Value
Absolute change
Change from previous value
jan 1, 1978
25.886
+25.886
0.0%
jan 1, 1979
26.573
+0.686
2.65%
jan 1, 1980
27.26
+0.687
2.59%
jan 1, 1981
27.808
+0.549
2.01%
jan 1, 1982
27.961
+0.152
0.55%
jan 1, 1983
27.931
-0.03
-0.11%
jan 1, 1984
28.677
+0.746
2.67%
jan 1, 1985
29.169
+0.492
1.72%
jan 1, 1986
29.428
+0.258
0.89%
jan 1, 1987
29.752
+0.324
1.1%
jan 1, 1988
30.083
+0.331
1.11%
jan 1, 1989
30.176
+0.093
0.31%
jan 1, 1990
30.384
+0.209
0.69%
jan 1, 1991
30.846
+0.461
1.52%
jan 1, 1992
31.402
+0.556
1.8%
jan 1, 1993
31.711
+0.309
0.98%
jan 1, 1994
32.409
+0.698
2.2%
jan 1, 1995
32.801
+0.392
1.21%
jan 1, 1996
33.652
+0.851
2.59%
jan 1, 1997
34.213
+0.56
1.67%
jan 1, 1998
34.578
+0.365
1.07%
jan 1, 1999
35.013
+0.435
1.26%
jan 1, 2000
35.687
+0.674
1.93%
jan 1, 2001
34.475
-1.212
-3.4%
jan 1, 2002
37.2
+2.725
7.91%
jan 1, 2003
38.593
+1.393
3.74%
jan 1, 2004
39.492
+0.899
2.33%
jan 1, 2005
39.975
+0.483
1.22%
jan 1, 2006
40.845
+0.869
2.17%
jan 1, 2007
42.021
+1.176
2.88%
jan 1, 2008
42.964
+0.944
2.25%
jan 1, 2009
44.37
+1.406
3.27%
jan 1, 2010
45.092
+0.722
1.63%
jan 1, 2011
45.44
+0.348
0.77%
jan 1, 2012
46.17
+0.729
1.61%
jan 1, 2013
47.406
+1.236
2.68%
jan 1, 2014
48.559
+1.153
2.43%
jan 1, 2015
50.097
+1.538
3.17%
Ranking of countries by current statistics by years


Comments: