29
/
en
AIzaSyAYiBZKx7MnpbEhh9jyipgxe19OcubqV5w
April 1, 2024
201834
Morocco
MAR
true
2
1
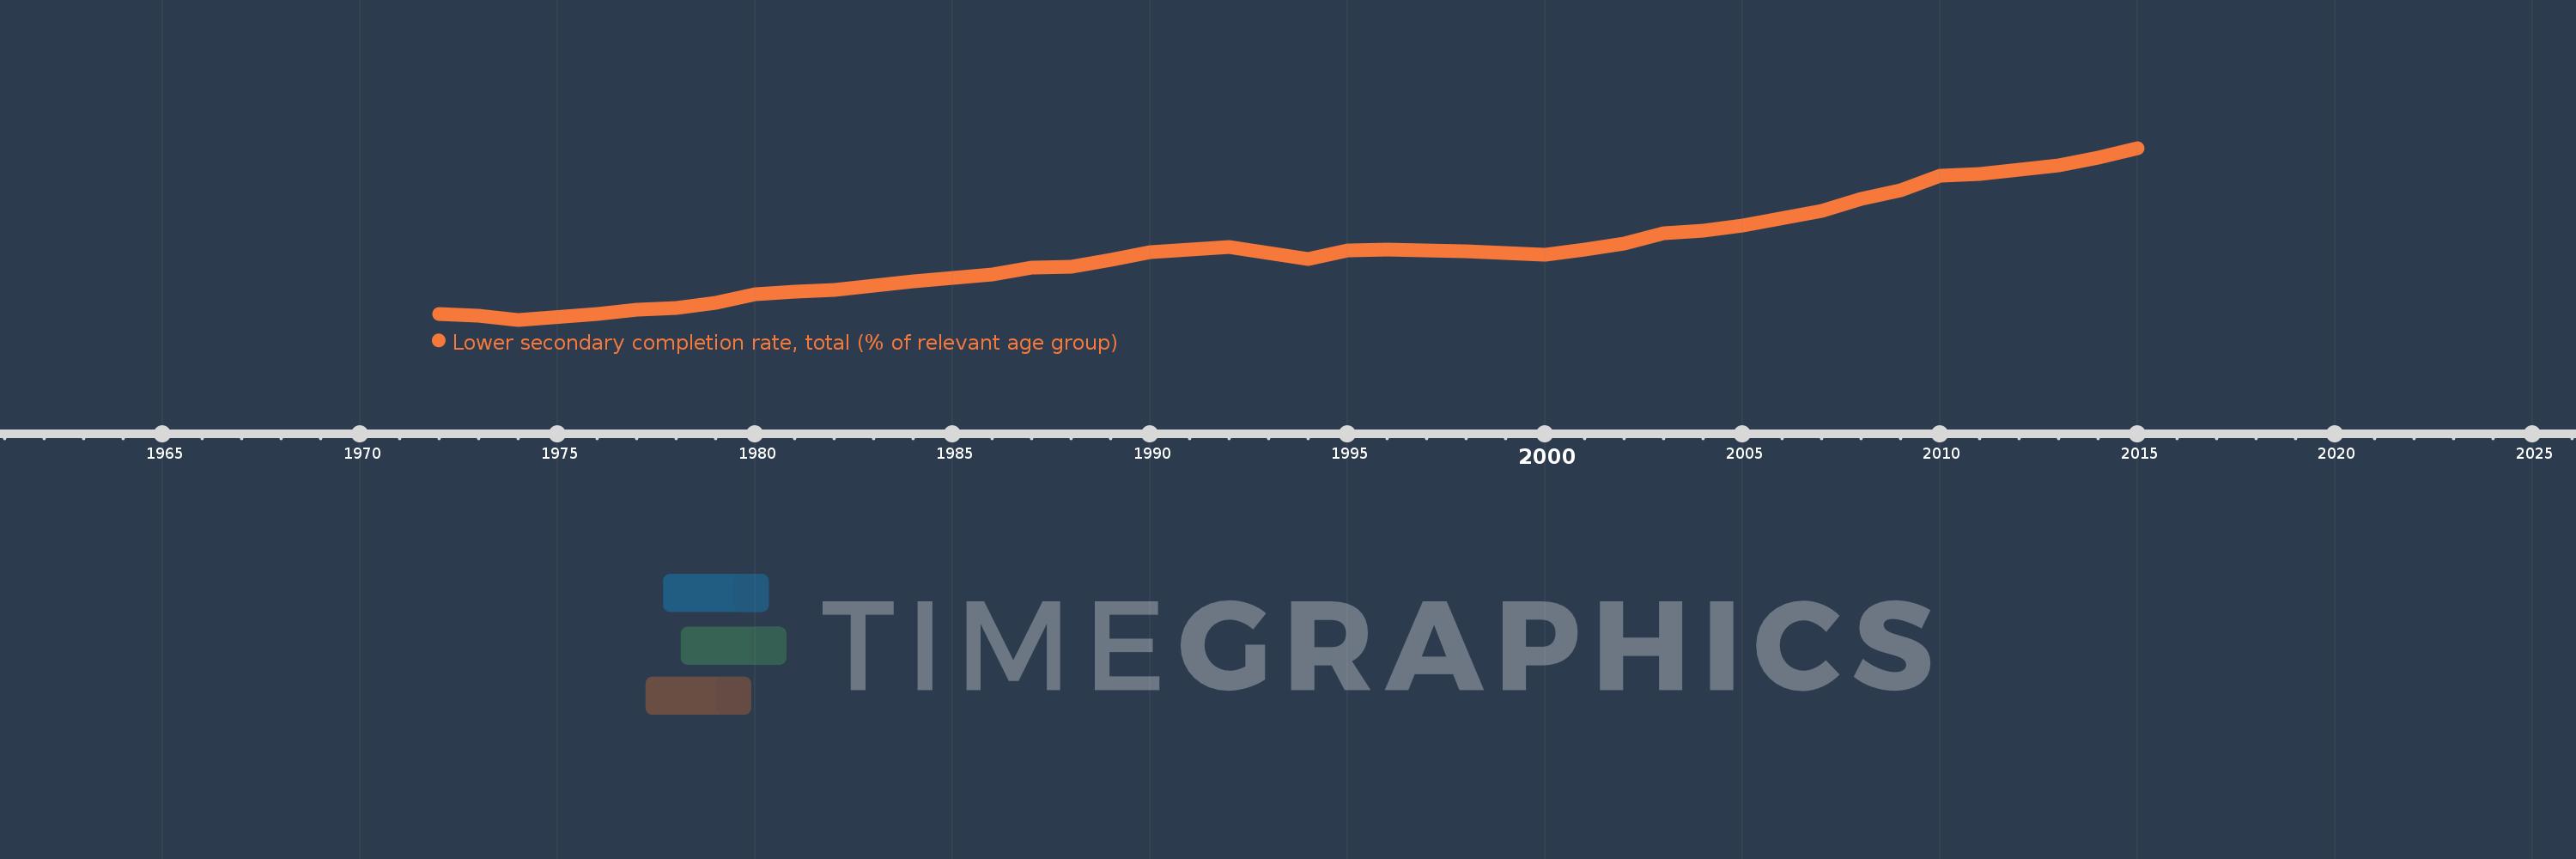
Lower secondary completion rate, total (% of relevant age group)
2015,2014,2013,2012,2011,2010,2009,2008,2007,2005,2004,2003,2002,2001,2000,1998,1996,1995,1994,1993,1992,1991,1990,1989,1988,1987,1986,1984,1982,1981,1980,1979,1978,1977,1976,1974,1973,1972
This statistics in other country:
AfghanistanAlbaniaAlgeriaAngolaAntigua and BarbudaArab WorldArgentinaArmeniaArubaAustriaAzerbaijanBahamas, TheBahrainBangladeshBarbadosBelarusBelgiumBelizeBeninBermudaBhutanBoliviaBosnia and HerzegovinaBotswanaBrazilBritish Virgin IslandsBrunei DarussalamBulgariaBurkina FasoBurundiCabo VerdeCambodiaCameroonCaribbean small statesCentral African RepublicCentral Europe and the BalticsChadChileChinaColombiaComorosCongo, Dem. Rep.Congo, Rep.Costa RicaCote d'IvoireCroatiaCubaCyprusCzech RepublicDenmarkDjiboutiDominicaDominican RepublicEarly-demographic dividendEast Asia & PacificEast Asia & Pacific (excluding high income)East Asia & Pacific (IDA & IBRD countries)EcuadorEgypt, Arab Rep.El SalvadorEquatorial GuineaEritreaEstoniaEthiopiaEuro areaEurope & Central AsiaEurope & Central Asia (excluding high income)Europe & Central Asia (IDA & IBRD countries)European UnionFijiFinlandFragile and conflict affected situationsFranceGabonGambia, TheGeorgiaGermanyGhanaGreeceGrenadaGuatemalaGuineaGuinea-BissauGuyanaHaitiHeavily indebted poor countries (HIPC)High incomeHondurasHong Kong SAR, ChinaHungaryIBRD onlyIcelandIDA & IBRD totalIDA blendIDA onlyIDA totalIndiaIndonesiaIran, Islamic Rep.IraqIrelandIsraelItalyJamaicaJapanJordanKazakhstanKenyaKiribatiKorea, Dem. People’s Rep.Korea, Rep.KuwaitKyrgyz RepublicLao PDRLate-demographic dividendLatin America & Caribbean Latin America & Caribbean (excluding high income)Latin America & the Caribbean (IDA & IBRD countries)LatviaLeast developed countries: UN classificationLebanonLesothoLiberiaLiechtensteinLithuaniaLow & middle incomeLow incomeLower middle incomeLuxembourgMacao SAR, ChinaMacedonia, FYRMadagascarMalawiMalaysiaMaldivesMaliMaltaMarshall IslandsMauritaniaMauritiusMexicoMiddle East & North AfricaMiddle East & North Africa (excluding high income)Middle East & North Africa (IDA & IBRD countries)Middle incomeMoldovaMongoliaMontenegroMoroccoMozambiqueMyanmarNamibiaNauruNepalNetherlandsNicaraguaNigerNorwayOECD membersOmanOther small statesPacific island small statesPakistanPalauPanamaPapua New GuineaParaguayPeruPhilippinesPolandPortugalPost-demographic dividendPre-demographic dividendQatarRomaniaRussian FederationRwandaSamoaSan MarinoSao Tome and PrincipeSaudi ArabiaSenegalSerbiaSeychellesSierra LeoneSlovak RepublicSloveniaSmall statesSolomon IslandsSouth AfricaSouth AsiaSouth Asia (IDA & IBRD)South SudanSpainSri LankaSt. Kitts and NevisSt. LuciaSt. Vincent and the GrenadinesSub-Saharan Africa Sub-Saharan Africa (excluding high income)Sub-Saharan Africa (IDA & IBRD countries)SudanSurinameSwazilandSwedenSwitzerlandSyrian Arab RepublicTajikistanTanzaniaThailandTimor-LesteTogoTongaTrinidad and TobagoTunisiaTurkeyTuvaluUgandaUkraineUnited Arab EmiratesUpper middle incomeUruguayUzbekistanVanuatuVenezuela, RBVietnamWest Bank and GazaWorldYemen, Rep.ZambiaZimbabwe Timeline:
This timeline shows a graph from 1972 to 2015 of Morocco. No data until 1971. Number of actual observations by date: 38.
Source name:
World Development Indicators
Source organization:
United Nations Educational, Scientific, and Cultural Organization (UNESCO) Institute for Statistics.
Categories, topics:
Education
Last updated:
apr 23, 2017
Indicators value changes by year
Maximum:
68.394
jan 1, 2015
At the date of observation
Value
Absolute change
Change from previous value
jan 1, 1972
10.745
+10.745
0.0%
jan 1, 1973
10.183
-0.562
-5.23%
jan 1, 1974
8.787
-1.396
-13.71%
jan 1, 1976
10.831
+2.043
23.25%
jan 1, 1977
12.276
+1.445
13.35%
jan 1, 1978
12.824
+0.547
4.46%
jan 1, 1979
14.73
+1.906
14.87%
jan 1, 1980
17.648
+2.918
19.81%
jan 1, 1981
18.506
+0.858
4.86%
jan 1, 1982
19.25
+0.744
4.02%
jan 1, 1984
22.116
+2.866
14.89%
jan 1, 1986
24.361
+2.245
10.15%
jan 1, 1987
26.763
+2.402
9.86%
jan 1, 1988
27.189
+0.426
1.59%
jan 1, 1989
29.639
+2.45
9.01%
jan 1, 1990
32.105
+2.466
8.32%
jan 1, 1991
32.998
+0.893
2.78%
jan 1, 1992
33.981
+0.982
2.98%
jan 1, 1993
31.898
-2.083
-6.13%
jan 1, 1994
29.779
-2.119
-6.64%
jan 1, 1995
32.789
+3.009
10.11%
jan 1, 1996
33.094
+0.305
0.93%
jan 1, 1998
32.514
-0.58
-1.75%
jan 1, 2000
31.288
-1.226
-3.77%
jan 1, 2001
33.185
+1.897
6.06%
jan 1, 2002
35.182
+1.997
6.02%
jan 1, 2003
38.81
+3.628
10.31%
jan 1, 2004
39.796
+0.986
2.54%
jan 1, 2005
41.37
+1.574
3.95%
jan 1, 2007
46.547
+5.177
12.51%
jan 1, 2008
50.845
+4.298
9.23%
jan 1, 2009
53.745
+2.9
5.7%
jan 1, 2010
58.879
+5.134
9.55%
jan 1, 2011
59.363
+0.484
0.82%
jan 1, 2012
60.716
+1.353
2.28%
jan 1, 2013
62.257
+1.541
2.54%
jan 1, 2014
64.896
+2.639
4.24%
jan 1, 2015
68.394
+3.498
5.39%
Ranking of countries by current statistics by years


Comments: