29
/
en
AIzaSyAYiBZKx7MnpbEhh9jyipgxe19OcubqV5w
April 1, 2024
53557
Other small states
OSS
false
2
1
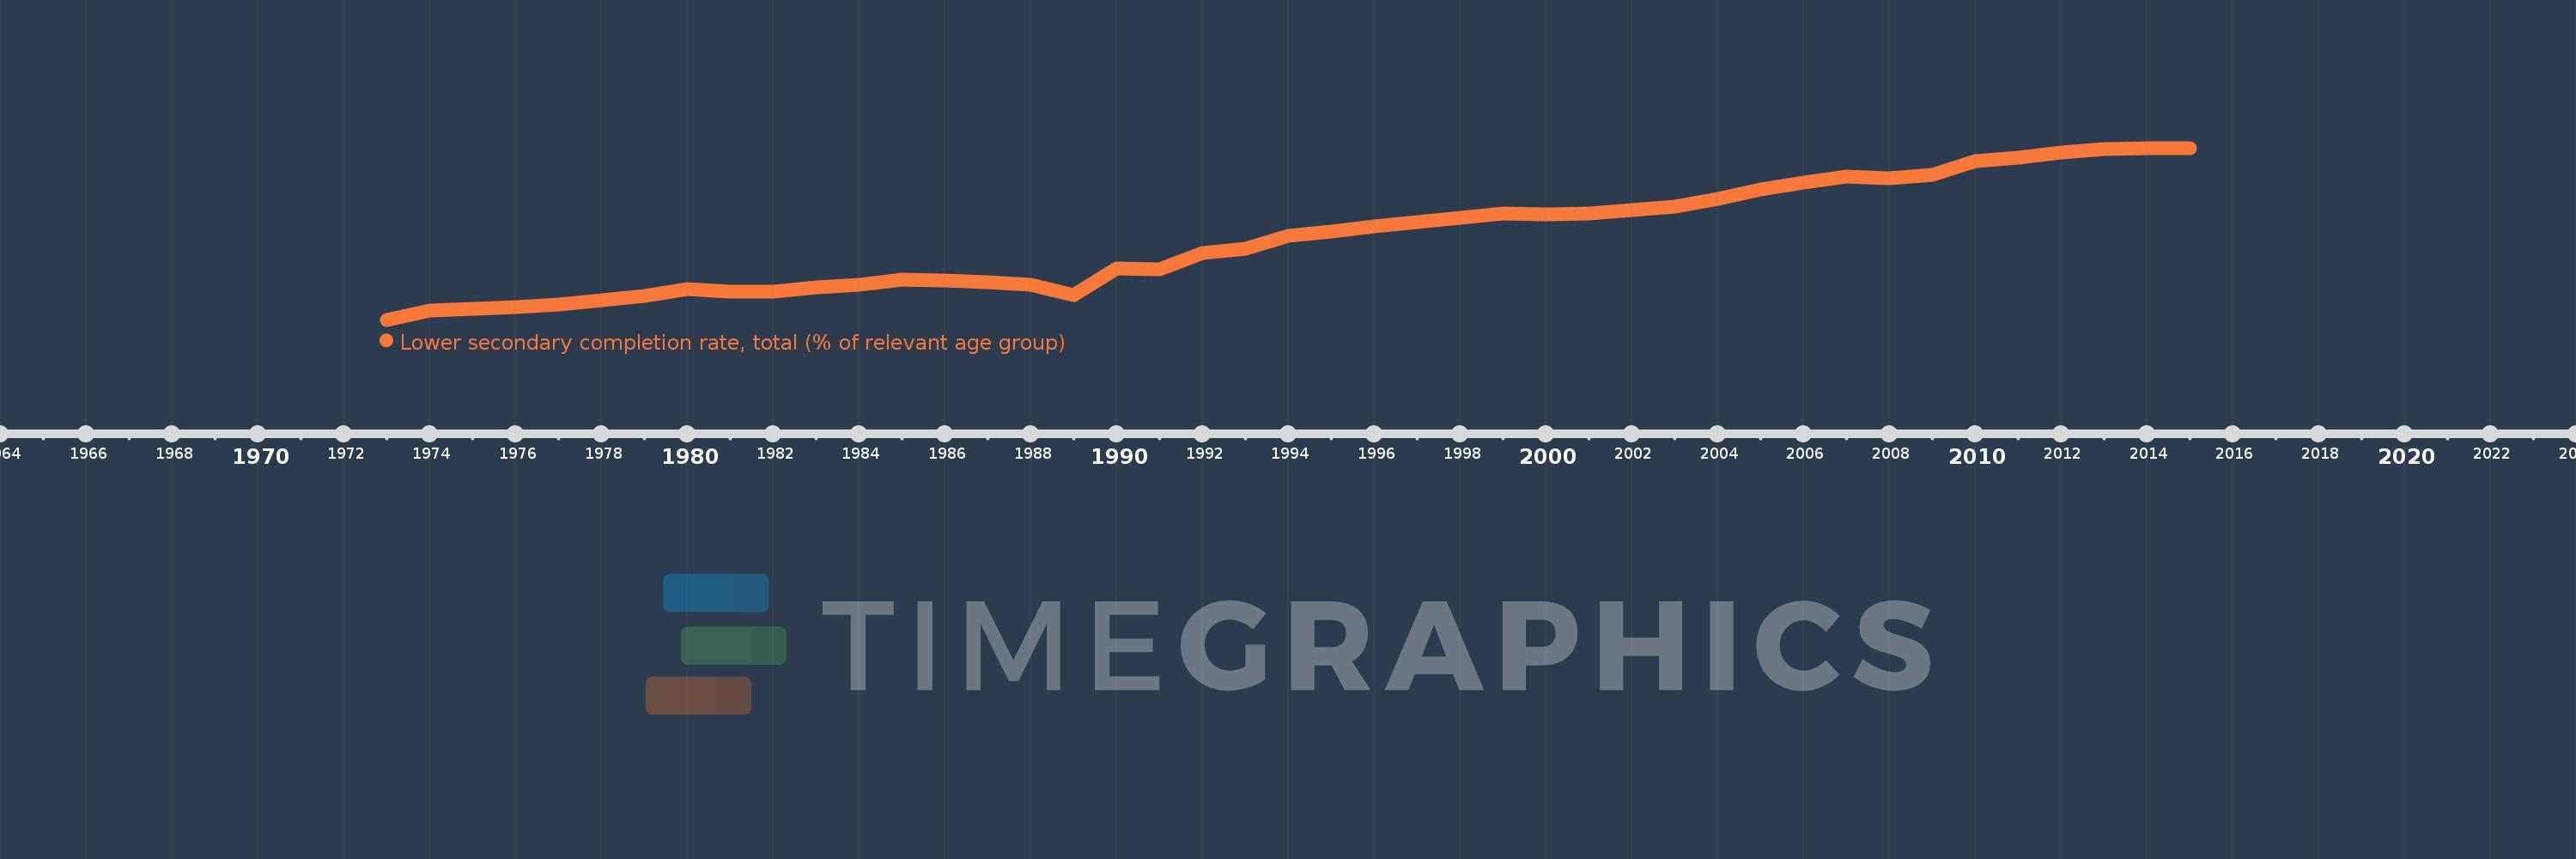
Lower secondary completion rate, total (% of relevant age group)
2015,2014,2013,2012,2011,2010,2009,2008,2007,2006,2005,2004,2003,2002,2001,2000,1999,1998,1997,1996,1995,1994,1993,1992,1991,1990,1989,1988,1987,1986,1985,1984,1983,1982,1981,1980,1979,1978,1977,1976,1975,1974,1973
This statistics in other country:
AfghanistanAlbaniaAlgeriaAngolaAntigua and BarbudaArab WorldArgentinaArmeniaArubaAustriaAzerbaijanBahamas, TheBahrainBangladeshBarbadosBelarusBelgiumBelizeBeninBermudaBhutanBoliviaBosnia and HerzegovinaBotswanaBrazilBritish Virgin IslandsBrunei DarussalamBulgariaBurkina FasoBurundiCabo VerdeCambodiaCameroonCaribbean small statesCentral African RepublicCentral Europe and the BalticsChadChileChinaColombiaComorosCongo, Dem. Rep.Congo, Rep.Costa RicaCote d'IvoireCroatiaCubaCyprusCzech RepublicDenmarkDjiboutiDominicaDominican RepublicEarly-demographic dividendEast Asia & PacificEast Asia & Pacific (excluding high income)East Asia & Pacific (IDA & IBRD countries)EcuadorEgypt, Arab Rep.El SalvadorEquatorial GuineaEritreaEstoniaEthiopiaEuro areaEurope & Central AsiaEurope & Central Asia (excluding high income)Europe & Central Asia (IDA & IBRD countries)European UnionFijiFinlandFragile and conflict affected situationsFranceGabonGambia, TheGeorgiaGermanyGhanaGreeceGrenadaGuatemalaGuineaGuinea-BissauGuyanaHaitiHeavily indebted poor countries (HIPC)High incomeHondurasHong Kong SAR, ChinaHungaryIBRD onlyIcelandIDA & IBRD totalIDA blendIDA onlyIDA totalIndiaIndonesiaIran, Islamic Rep.IraqIrelandIsraelItalyJamaicaJapanJordanKazakhstanKenyaKiribatiKorea, Dem. People’s Rep.Korea, Rep.KuwaitKyrgyz RepublicLao PDRLate-demographic dividendLatin America & Caribbean Latin America & Caribbean (excluding high income)Latin America & the Caribbean (IDA & IBRD countries)LatviaLeast developed countries: UN classificationLebanonLesothoLiberiaLiechtensteinLithuaniaLow & middle incomeLow incomeLower middle incomeLuxembourgMacao SAR, ChinaMacedonia, FYRMadagascarMalawiMalaysiaMaldivesMaliMaltaMarshall IslandsMauritaniaMauritiusMexicoMiddle East & North AfricaMiddle East & North Africa (excluding high income)Middle East & North Africa (IDA & IBRD countries)Middle incomeMoldovaMongoliaMontenegroMoroccoMozambiqueMyanmarNamibiaNauruNepalNetherlandsNicaraguaNigerNorwayOECD membersOmanOther small statesPacific island small statesPakistanPalauPanamaPapua New GuineaParaguayPeruPhilippinesPolandPortugalPost-demographic dividendPre-demographic dividendQatarRomaniaRussian FederationRwandaSamoaSan MarinoSao Tome and PrincipeSaudi ArabiaSenegalSerbiaSeychellesSierra LeoneSlovak RepublicSloveniaSmall statesSolomon IslandsSouth AfricaSouth AsiaSouth Asia (IDA & IBRD)South SudanSpainSri LankaSt. Kitts and NevisSt. LuciaSt. Vincent and the GrenadinesSub-Saharan Africa Sub-Saharan Africa (excluding high income)Sub-Saharan Africa (IDA & IBRD countries)SudanSurinameSwazilandSwedenSwitzerlandSyrian Arab RepublicTajikistanTanzaniaThailandTimor-LesteTogoTongaTrinidad and TobagoTunisiaTurkeyTuvaluUgandaUkraineUnited Arab EmiratesUpper middle incomeUruguayUzbekistanVanuatuVenezuela, RBVietnamWest Bank and GazaWorldYemen, Rep.ZambiaZimbabwe Timeline:
This timeline shows a graph from 1973 to 2015 of Other small states. No data until 1972. Number of actual observations by date: 43.
Source name:
World Development Indicators
Source organization:
United Nations Educational, Scientific, and Cultural Organization (UNESCO) Institute for Statistics.
Categories, topics:
Education
Last updated:
apr 23, 2017
Indicators value changes by year
Minimum:
30.238
jan 1, 1973
Maximum:
62.977
jan 1, 2014
At the date of observation
Value
Absolute change
Change from previous value
jan 1, 1973
30.238
+30.238
0.0%
jan 1, 1974
31.949
+1.711
5.66%
jan 1, 1975
32.348
+0.399
1.25%
jan 1, 1976
32.686
+0.338
1.04%
jan 1, 1977
33.136
+0.45
1.38%
jan 1, 1978
34.022
+0.886
2.67%
jan 1, 1979
34.749
+0.727
2.14%
jan 1, 1980
36.082
+1.333
3.84%
jan 1, 1981
35.559
-0.524
-1.45%
jan 1, 1982
35.631
+0.072
0.2%
jan 1, 1983
36.425
+0.794
2.23%
jan 1, 1984
36.923
+0.498
1.37%
jan 1, 1985
37.871
+0.948
2.57%
jan 1, 1986
37.798
-0.073
-0.19%
jan 1, 1987
37.336
-0.463
-1.22%
jan 1, 1988
36.958
-0.378
-1.01%
jan 1, 1989
34.997
-1.961
-5.31%
jan 1, 1990
39.988
+4.992
14.26%
jan 1, 1991
39.91
-0.078
-0.2%
jan 1, 1992
43.002
+3.091
7.75%
jan 1, 1993
43.821
+0.819
1.9%
jan 1, 1994
46.152
+2.331
5.32%
jan 1, 1995
47.115
+0.963
2.09%
jan 1, 1996
48.077
+0.962
2.04%
jan 1, 1997
48.88
+0.804
1.67%
jan 1, 1998
49.66
+0.78
1.6%
jan 1, 1999
50.499
+0.839
1.69%
jan 1, 2000
50.25
-0.249
-0.49%
jan 1, 2001
50.531
+0.282
0.56%
jan 1, 2002
51.109
+0.578
1.14%
jan 1, 2003
51.747
+0.638
1.25%
jan 1, 2004
53.215
+1.469
2.84%
jan 1, 2005
55.059
+1.844
3.46%
jan 1, 2006
56.395
+1.336
2.43%
jan 1, 2007
57.51
+1.115
1.98%
jan 1, 2008
57.136
-0.374
-0.65%
jan 1, 2009
57.914
+0.778
1.36%
jan 1, 2010
60.428
+2.513
4.34%
jan 1, 2011
61.198
+0.771
1.28%
jan 1, 2012
62.033
+0.835
1.36%
jan 1, 2013
62.765
+0.733
1.18%
jan 1, 2014
62.977
+0.212
0.34%
jan 1, 2015
62.931
-0.046
-0.07%
Ranking of countries by current statistics by years


Comments: