29
/
en
AIzaSyAYiBZKx7MnpbEhh9jyipgxe19OcubqV5w
April 1, 2024
95112
Burkina Faso
BFA
true
2
1
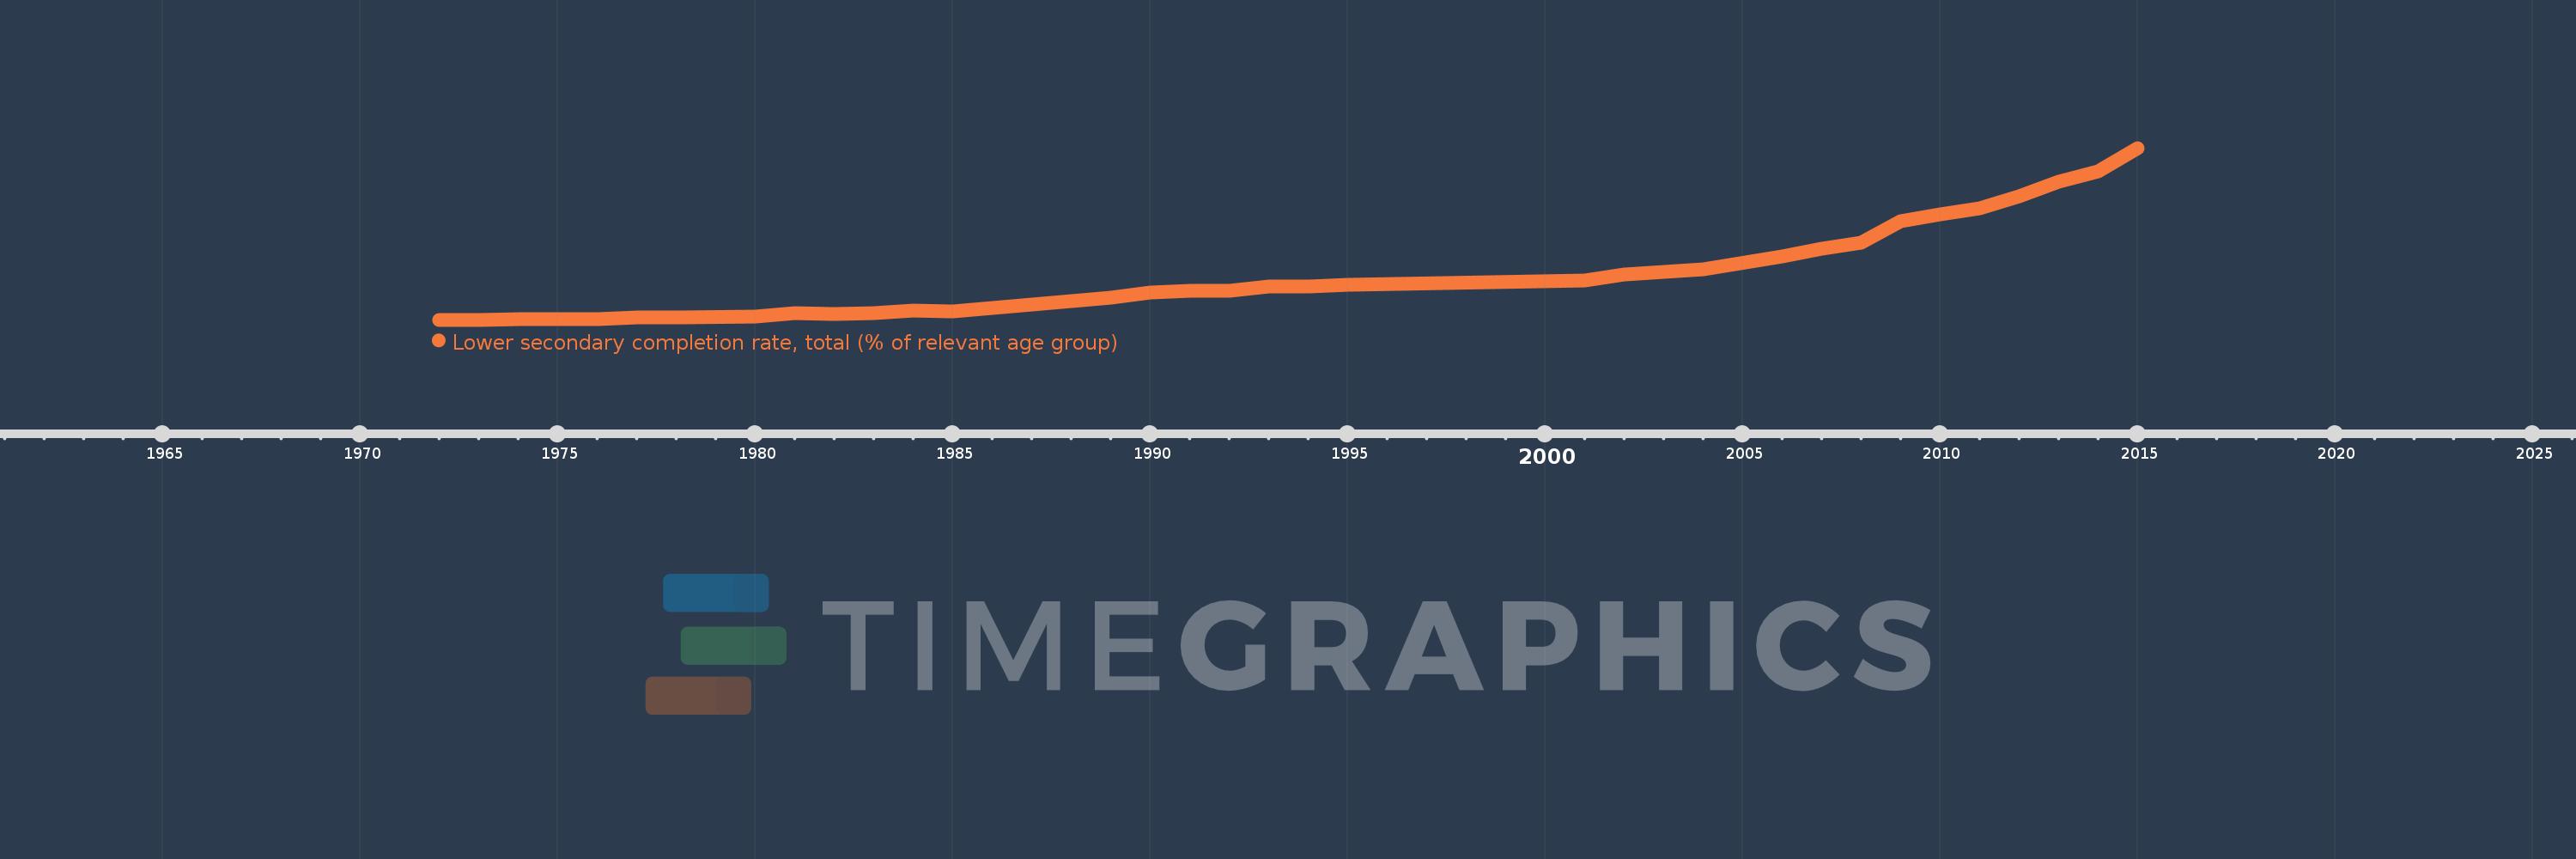
Lower secondary completion rate, total (% of relevant age group)
2015,2014,2013,2012,2011,2010,2009,2008,2007,2006,2004,2002,2001,1995,1994,1993,1992,1991,1990,1989,1987,1985,1984,1983,1982,1981,1980,1978,1977,1976,1975,1974,1973,1972
This statistics in other country:
AfghanistanAlbaniaAlgeriaAngolaAntigua and BarbudaArab WorldArgentinaArmeniaArubaAustriaAzerbaijanBahamas, TheBahrainBangladeshBarbadosBelarusBelgiumBelizeBeninBermudaBhutanBoliviaBosnia and HerzegovinaBotswanaBrazilBritish Virgin IslandsBrunei DarussalamBulgariaBurkina FasoBurundiCabo VerdeCambodiaCameroonCaribbean small statesCentral African RepublicCentral Europe and the BalticsChadChileChinaColombiaComorosCongo, Dem. Rep.Congo, Rep.Costa RicaCote d'IvoireCroatiaCubaCyprusCzech RepublicDenmarkDjiboutiDominicaDominican RepublicEarly-demographic dividendEast Asia & PacificEast Asia & Pacific (excluding high income)East Asia & Pacific (IDA & IBRD countries)EcuadorEgypt, Arab Rep.El SalvadorEquatorial GuineaEritreaEstoniaEthiopiaEuro areaEurope & Central AsiaEurope & Central Asia (excluding high income)Europe & Central Asia (IDA & IBRD countries)European UnionFijiFinlandFragile and conflict affected situationsFranceGabonGambia, TheGeorgiaGermanyGhanaGreeceGrenadaGuatemalaGuineaGuinea-BissauGuyanaHaitiHeavily indebted poor countries (HIPC)High incomeHondurasHong Kong SAR, ChinaHungaryIBRD onlyIcelandIDA & IBRD totalIDA blendIDA onlyIDA totalIndiaIndonesiaIran, Islamic Rep.IraqIrelandIsraelItalyJamaicaJapanJordanKazakhstanKenyaKiribatiKorea, Dem. People’s Rep.Korea, Rep.KuwaitKyrgyz RepublicLao PDRLate-demographic dividendLatin America & Caribbean Latin America & Caribbean (excluding high income)Latin America & the Caribbean (IDA & IBRD countries)LatviaLeast developed countries: UN classificationLebanonLesothoLiberiaLiechtensteinLithuaniaLow & middle incomeLow incomeLower middle incomeLuxembourgMacao SAR, ChinaMacedonia, FYRMadagascarMalawiMalaysiaMaldivesMaliMaltaMarshall IslandsMauritaniaMauritiusMexicoMiddle East & North AfricaMiddle East & North Africa (excluding high income)Middle East & North Africa (IDA & IBRD countries)Middle incomeMoldovaMongoliaMontenegroMoroccoMozambiqueMyanmarNamibiaNauruNepalNetherlandsNicaraguaNigerNorwayOECD membersOmanOther small statesPacific island small statesPakistanPalauPanamaPapua New GuineaParaguayPeruPhilippinesPolandPortugalPost-demographic dividendPre-demographic dividendQatarRomaniaRussian FederationRwandaSamoaSan MarinoSao Tome and PrincipeSaudi ArabiaSenegalSerbiaSeychellesSierra LeoneSlovak RepublicSloveniaSmall statesSolomon IslandsSouth AfricaSouth AsiaSouth Asia (IDA & IBRD)South SudanSpainSri LankaSt. Kitts and NevisSt. LuciaSt. Vincent and the GrenadinesSub-Saharan Africa Sub-Saharan Africa (excluding high income)Sub-Saharan Africa (IDA & IBRD countries)SudanSurinameSwazilandSwedenSwitzerlandSyrian Arab RepublicTajikistanTanzaniaThailandTimor-LesteTogoTongaTrinidad and TobagoTunisiaTurkeyTuvaluUgandaUkraineUnited Arab EmiratesUpper middle incomeUruguayUzbekistanVanuatuVenezuela, RBVietnamWest Bank and GazaWorldYemen, Rep.ZambiaZimbabwe Timeline:
This timeline shows a graph from 1972 to 2015 of Burkina Faso. No data until 1971. Number of actual observations by date: 34.
Source name:
World Development Indicators
Source organization:
United Nations Educational, Scientific, and Cultural Organization (UNESCO) Institute for Statistics.
Categories, topics:
Education
Last updated:
apr 23, 2017
Indicators value changes by year
Maximum:
24.747
jan 1, 2015
At the date of observation
Value
Absolute change
Change from previous value
jan 1, 1972
1.159
+1.159
0.0%
jan 1, 1973
1.146
-0.013
-1.13%
jan 1, 1974
1.205
+0.059
5.11%
jan 1, 1975
1.269
+0.065
5.38%
jan 1, 1976
1.27
+0.001
0.04%
jan 1, 1977
1.408
+0.138
10.84%
jan 1, 1978
1.438
+0.03
2.13%
jan 1, 1980
1.526
+0.089
6.16%
jan 1, 1981
2.085
+0.558
36.59%
jan 1, 1982
1.919
-0.166
-7.97%
jan 1, 1983
2.094
+0.176
9.16%
jan 1, 1984
2.362
+0.268
12.8%
jan 1, 1985
2.307
-0.055
-2.34%
jan 1, 1987
3.276
+0.969
42.01%
jan 1, 1989
4.187
+0.911
27.81%
jan 1, 1990
4.923
+0.735
17.56%
jan 1, 1991
5.117
+0.194
3.95%
jan 1, 1992
5.16
+0.043
0.83%
jan 1, 1993
5.745
+0.585
11.35%
jan 1, 1994
5.733
-0.012
-0.21%
jan 1, 1995
5.966
+0.232
4.05%
jan 1, 2001
6.544
+0.578
9.69%
jan 1, 2002
7.4
+0.857
13.09%
jan 1, 2004
8.127
+0.727
9.83%
jan 1, 2006
9.894
+1.767
21.74%
jan 1, 2007
10.898
+1.004
10.15%
jan 1, 2008
11.704
+0.806
7.39%
jan 1, 2009
14.732
+3.028
25.87%
jan 1, 2010
15.571
+0.838
5.69%
jan 1, 2011
16.436
+0.865
5.56%
jan 1, 2012
18.074
+1.638
9.97%
jan 1, 2013
20.166
+2.093
11.58%
jan 1, 2014
21.489
+1.323
6.56%
jan 1, 2015
24.747
+3.257
15.16%
Ranking of countries by current statistics by years


Comments: