29
/
en
AIzaSyAYiBZKx7MnpbEhh9jyipgxe19OcubqV5w
April 1, 2024
31797
Europe & Central Asia (excluding high income)
ECA
false
2
1
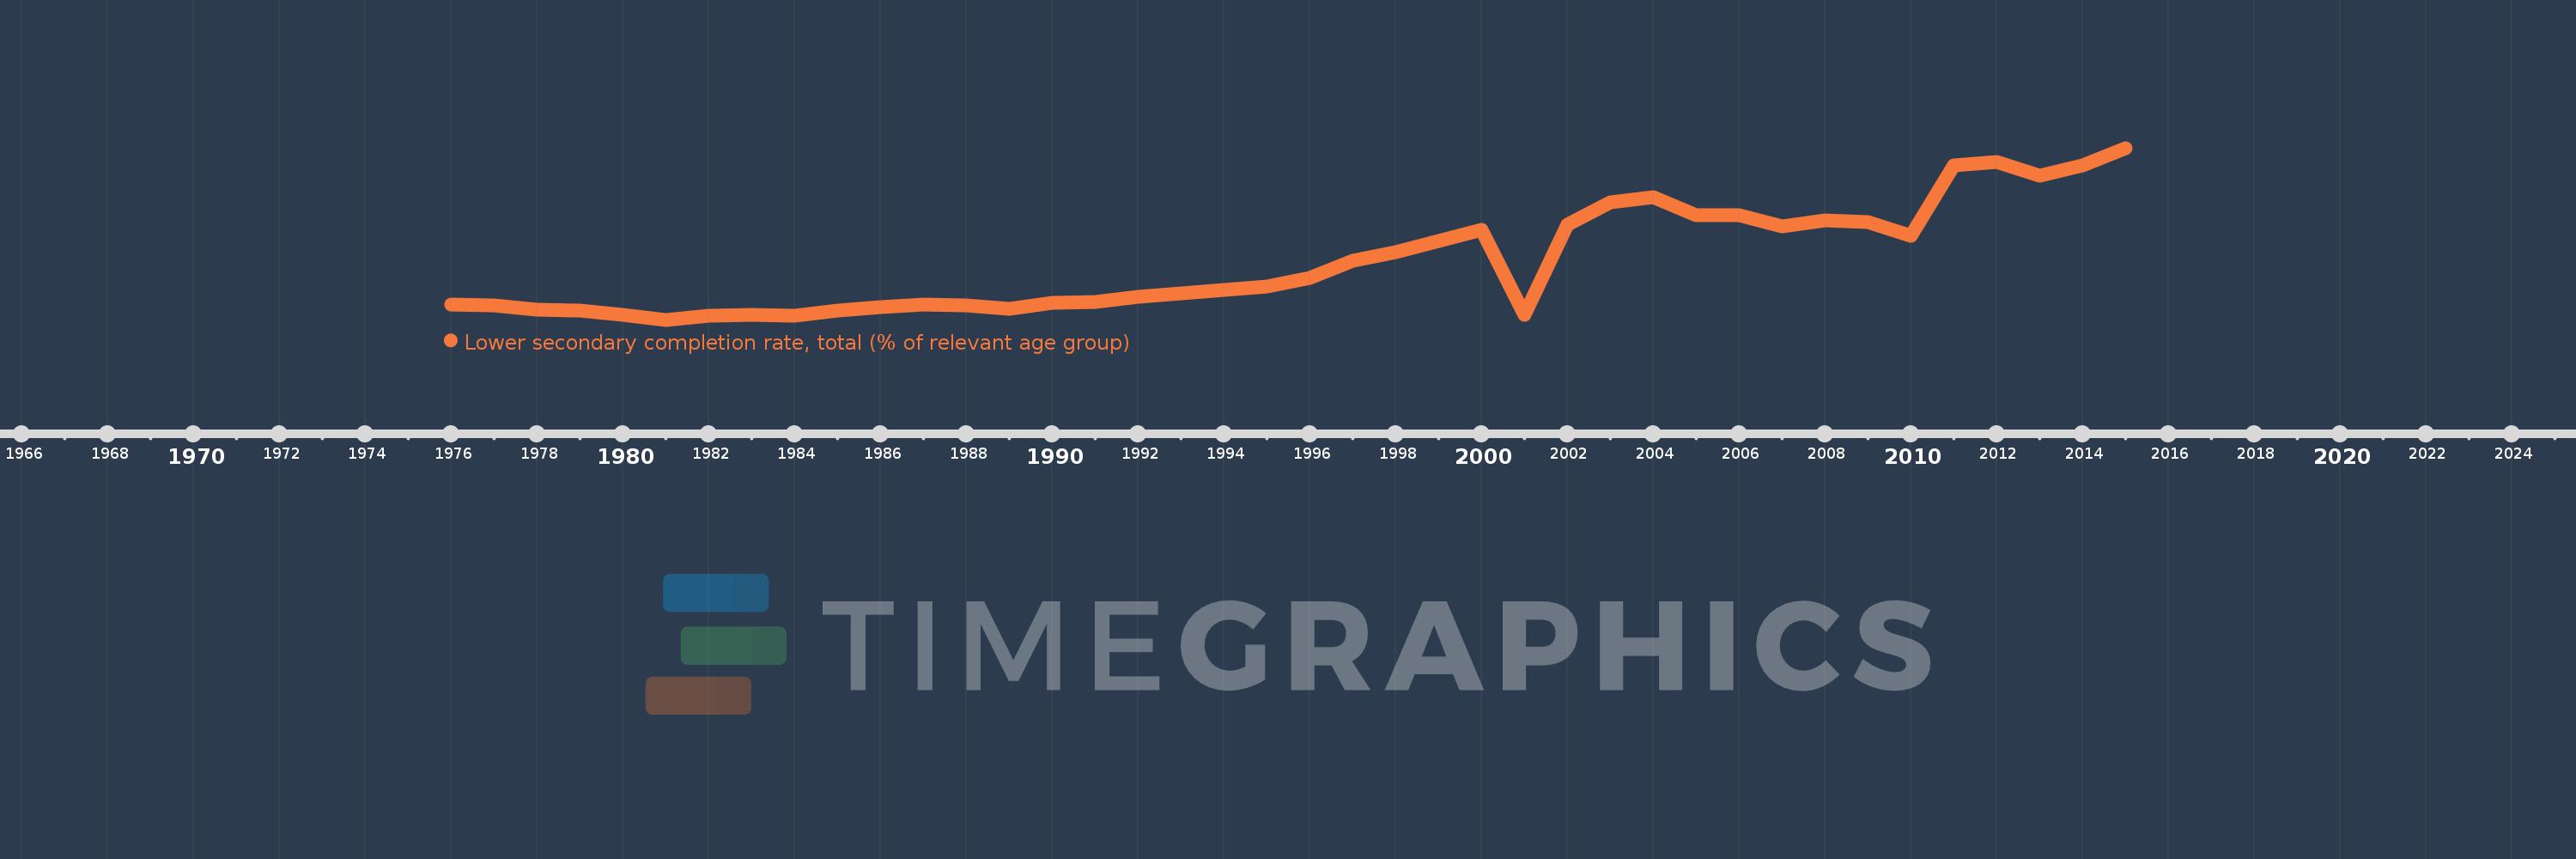
Lower secondary completion rate, total (% of relevant age group)
2015,2014,2013,2012,2011,2010,2009,2008,2007,2006,2005,2004,2003,2002,2001,2000,1999,1998,1997,1996,1995,1994,1993,1992,1991,1990,1989,1988,1987,1986,1985,1984,1983,1982,1981,1980,1979,1978,1977,1976
This statistics in other country:
AfghanistanAlbaniaAlgeriaAngolaAntigua and BarbudaArab WorldArgentinaArmeniaArubaAustriaAzerbaijanBahamas, TheBahrainBangladeshBarbadosBelarusBelgiumBelizeBeninBermudaBhutanBoliviaBosnia and HerzegovinaBotswanaBrazilBritish Virgin IslandsBrunei DarussalamBulgariaBurkina FasoBurundiCabo VerdeCambodiaCameroonCaribbean small statesCentral African RepublicCentral Europe and the BalticsChadChileChinaColombiaComorosCongo, Dem. Rep.Congo, Rep.Costa RicaCote d'IvoireCroatiaCubaCyprusCzech RepublicDenmarkDjiboutiDominicaDominican RepublicEarly-demographic dividendEast Asia & PacificEast Asia & Pacific (excluding high income)East Asia & Pacific (IDA & IBRD countries)EcuadorEgypt, Arab Rep.El SalvadorEquatorial GuineaEritreaEstoniaEthiopiaEuro areaEurope & Central AsiaEurope & Central Asia (excluding high income)Europe & Central Asia (IDA & IBRD countries)European UnionFijiFinlandFragile and conflict affected situationsFranceGabonGambia, TheGeorgiaGermanyGhanaGreeceGrenadaGuatemalaGuineaGuinea-BissauGuyanaHaitiHeavily indebted poor countries (HIPC)High incomeHondurasHong Kong SAR, ChinaHungaryIBRD onlyIcelandIDA & IBRD totalIDA blendIDA onlyIDA totalIndiaIndonesiaIran, Islamic Rep.IraqIrelandIsraelItalyJamaicaJapanJordanKazakhstanKenyaKiribatiKorea, Dem. People’s Rep.Korea, Rep.KuwaitKyrgyz RepublicLao PDRLate-demographic dividendLatin America & Caribbean Latin America & Caribbean (excluding high income)Latin America & the Caribbean (IDA & IBRD countries)LatviaLeast developed countries: UN classificationLebanonLesothoLiberiaLiechtensteinLithuaniaLow & middle incomeLow incomeLower middle incomeLuxembourgMacao SAR, ChinaMacedonia, FYRMadagascarMalawiMalaysiaMaldivesMaliMaltaMarshall IslandsMauritaniaMauritiusMexicoMiddle East & North AfricaMiddle East & North Africa (excluding high income)Middle East & North Africa (IDA & IBRD countries)Middle incomeMoldovaMongoliaMontenegroMoroccoMozambiqueMyanmarNamibiaNauruNepalNetherlandsNicaraguaNigerNorwayOECD membersOmanOther small statesPacific island small statesPakistanPalauPanamaPapua New GuineaParaguayPeruPhilippinesPolandPortugalPost-demographic dividendPre-demographic dividendQatarRomaniaRussian FederationRwandaSamoaSan MarinoSao Tome and PrincipeSaudi ArabiaSenegalSerbiaSeychellesSierra LeoneSlovak RepublicSloveniaSmall statesSolomon IslandsSouth AfricaSouth AsiaSouth Asia (IDA & IBRD)South SudanSpainSri LankaSt. Kitts and NevisSt. LuciaSt. Vincent and the GrenadinesSub-Saharan Africa Sub-Saharan Africa (excluding high income)Sub-Saharan Africa (IDA & IBRD countries)SudanSurinameSwazilandSwedenSwitzerlandSyrian Arab RepublicTajikistanTanzaniaThailandTimor-LesteTogoTongaTrinidad and TobagoTunisiaTurkeyTuvaluUgandaUkraineUnited Arab EmiratesUpper middle incomeUruguayUzbekistanVanuatuVenezuela, RBVietnamWest Bank and GazaWorldYemen, Rep.ZambiaZimbabwe Timeline:
This timeline shows a graph from 1976 to 2015 of Europe & Central Asia (excluding high income). No data until 1975. Number of actual observations by date: 40.
Source name:
World Development Indicators
Source organization:
United Nations Educational, Scientific, and Cultural Organization (UNESCO) Institute for Statistics.
Categories, topics:
Education
Last updated:
apr 23, 2017
Indicators value changes by year
Minimum:
77.038
jan 1, 1981
Maximum:
95.938
jan 1, 2015
At the date of observation
Value
Absolute change
Change from previous value
jan 1, 1976
78.736
+78.736
0.0%
jan 1, 1977
78.658
-0.078
-0.1%
jan 1, 1978
78.11
-0.548
-0.7%
jan 1, 1979
78.007
-0.103
-0.13%
jan 1, 1980
77.546
-0.461
-0.59%
jan 1, 1981
77.038
-0.507
-0.65%
jan 1, 1982
77.474
+0.436
0.57%
jan 1, 1983
77.537
+0.063
0.08%
jan 1, 1984
77.487
-0.05
-0.06%
jan 1, 1985
78.032
+0.545
0.7%
jan 1, 1986
78.457
+0.424
0.54%
jan 1, 1987
78.668
+0.211
0.27%
jan 1, 1988
78.629
-0.039
-0.05%
jan 1, 1989
78.225
-0.404
-0.51%
jan 1, 1990
78.886
+0.662
0.85%
jan 1, 1991
78.963
+0.077
0.1%
jan 1, 1992
79.59
+0.627
0.79%
jan 1, 1993
79.895
+0.305
0.38%
jan 1, 1994
80.303
+0.408
0.51%
jan 1, 1995
80.671
+0.368
0.46%
jan 1, 1996
81.611
+0.939
1.16%
jan 1, 1997
83.543
+1.933
2.37%
jan 1, 1998
84.518
+0.975
1.17%
jan 1, 1999
85.697
+1.179
1.4%
jan 1, 2000
86.928
+1.23
1.44%
jan 1, 2001
77.575
-9.353
-10.76%
jan 1, 2002
87.51
+9.934
12.81%
jan 1, 2003
89.987
+2.477
2.83%
jan 1, 2004
90.509
+0.522
0.58%
jan 1, 2005
88.578
-1.932
-2.13%
jan 1, 2006
88.564
-0.013
-0.02%
jan 1, 2007
87.345
-1.219
-1.38%
jan 1, 2008
88.006
+0.661
0.76%
jan 1, 2009
87.748
-0.258
-0.29%
jan 1, 2010
86.285
-1.463
-1.67%
jan 1, 2011
93.977
+7.692
8.91%
jan 1, 2012
94.435
+0.457
0.49%
jan 1, 2013
92.907
-1.528
-1.62%
jan 1, 2014
93.973
+1.066
1.15%
jan 1, 2015
95.938
+1.965
2.09%
Ranking of countries by current statistics by years


Comments: