29
/
en
AIzaSyAYiBZKx7MnpbEhh9jyipgxe19OcubqV5w
April 1, 2024
55687
Pre-demographic dividend
PRE
false
2
1
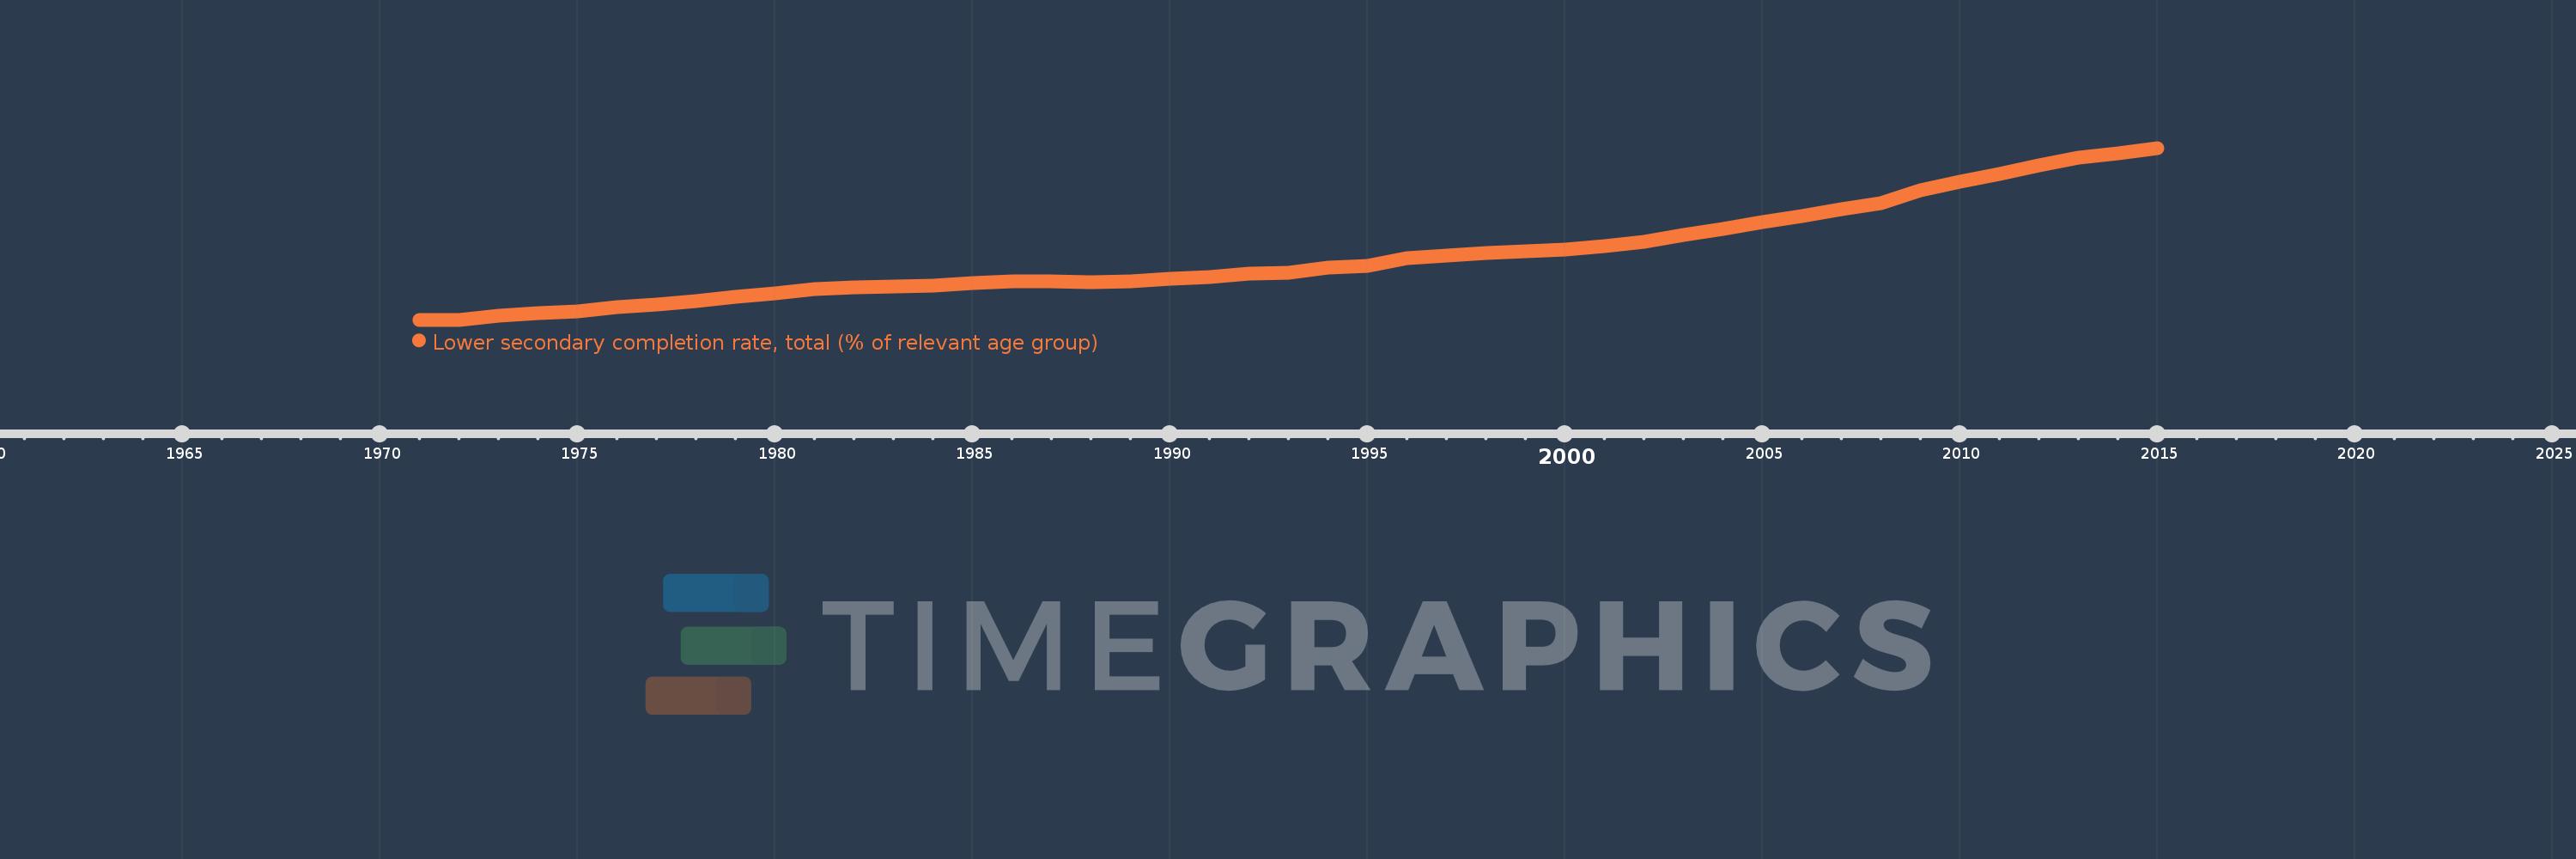
Lower secondary completion rate, total (% of relevant age group)
2015,2014,2013,2012,2011,2010,2009,2008,2007,2006,2005,2004,2003,2002,2001,2000,1999,1998,1997,1996,1995,1994,1993,1992,1991,1990,1989,1988,1987,1986,1985,1984,1983,1982,1981,1980,1979,1978,1977,1976,1975,1974,1973,1972,1971
This statistics in other country:
AfghanistanAlbaniaAlgeriaAngolaAntigua and BarbudaArab WorldArgentinaArmeniaArubaAustriaAzerbaijanBahamas, TheBahrainBangladeshBarbadosBelarusBelgiumBelizeBeninBermudaBhutanBoliviaBosnia and HerzegovinaBotswanaBrazilBritish Virgin IslandsBrunei DarussalamBulgariaBurkina FasoBurundiCabo VerdeCambodiaCameroonCaribbean small statesCentral African RepublicCentral Europe and the BalticsChadChileChinaColombiaComorosCongo, Dem. Rep.Congo, Rep.Costa RicaCote d'IvoireCroatiaCubaCyprusCzech RepublicDenmarkDjiboutiDominicaDominican RepublicEarly-demographic dividendEast Asia & PacificEast Asia & Pacific (excluding high income)East Asia & Pacific (IDA & IBRD countries)EcuadorEgypt, Arab Rep.El SalvadorEquatorial GuineaEritreaEstoniaEthiopiaEuro areaEurope & Central AsiaEurope & Central Asia (excluding high income)Europe & Central Asia (IDA & IBRD countries)European UnionFijiFinlandFragile and conflict affected situationsFranceGabonGambia, TheGeorgiaGermanyGhanaGreeceGrenadaGuatemalaGuineaGuinea-BissauGuyanaHaitiHeavily indebted poor countries (HIPC)High incomeHondurasHong Kong SAR, ChinaHungaryIBRD onlyIcelandIDA & IBRD totalIDA blendIDA onlyIDA totalIndiaIndonesiaIran, Islamic Rep.IraqIrelandIsraelItalyJamaicaJapanJordanKazakhstanKenyaKiribatiKorea, Dem. People’s Rep.Korea, Rep.KuwaitKyrgyz RepublicLao PDRLate-demographic dividendLatin America & Caribbean Latin America & Caribbean (excluding high income)Latin America & the Caribbean (IDA & IBRD countries)LatviaLeast developed countries: UN classificationLebanonLesothoLiberiaLiechtensteinLithuaniaLow & middle incomeLow incomeLower middle incomeLuxembourgMacao SAR, ChinaMacedonia, FYRMadagascarMalawiMalaysiaMaldivesMaliMaltaMarshall IslandsMauritaniaMauritiusMexicoMiddle East & North AfricaMiddle East & North Africa (excluding high income)Middle East & North Africa (IDA & IBRD countries)Middle incomeMoldovaMongoliaMontenegroMoroccoMozambiqueMyanmarNamibiaNauruNepalNetherlandsNicaraguaNigerNorwayOECD membersOmanOther small statesPacific island small statesPakistanPalauPanamaPapua New GuineaParaguayPeruPhilippinesPolandPortugalPost-demographic dividendPre-demographic dividendQatarRomaniaRussian FederationRwandaSamoaSan MarinoSao Tome and PrincipeSaudi ArabiaSenegalSerbiaSeychellesSierra LeoneSlovak RepublicSloveniaSmall statesSolomon IslandsSouth AfricaSouth AsiaSouth Asia (IDA & IBRD)South SudanSpainSri LankaSt. Kitts and NevisSt. LuciaSt. Vincent and the GrenadinesSub-Saharan Africa Sub-Saharan Africa (excluding high income)Sub-Saharan Africa (IDA & IBRD countries)SudanSurinameSwazilandSwedenSwitzerlandSyrian Arab RepublicTajikistanTanzaniaThailandTimor-LesteTogoTongaTrinidad and TobagoTunisiaTurkeyTuvaluUgandaUkraineUnited Arab EmiratesUpper middle incomeUruguayUzbekistanVanuatuVenezuela, RBVietnamWest Bank and GazaWorldYemen, Rep.ZambiaZimbabwe Timeline:
This timeline shows a graph from 1971 to 2015 of Pre-demographic dividend. No data until 1970. Number of actual observations by date: 45.
Source name:
World Development Indicators
Source organization:
United Nations Educational, Scientific, and Cultural Organization (UNESCO) Institute for Statistics.
Categories, topics:
Education
Last updated:
apr 23, 2017
Indicators value changes by year
Minimum:
12.692
jan 1, 1972
Maximum:
39.819
jan 1, 2015
At the date of observation
Value
Absolute change
Change from previous value
jan 1, 1971
12.705
+12.705
0.0%
jan 1, 1972
12.692
-0.012
-0.1%
jan 1, 1973
13.365
+0.673
5.3%
jan 1, 1974
13.713
+0.347
2.6%
jan 1, 1975
14.009
+0.296
2.16%
jan 1, 1976
14.676
+0.667
4.76%
jan 1, 1977
15.026
+0.351
2.39%
jan 1, 1978
15.577
+0.55
3.66%
jan 1, 1979
16.262
+0.685
4.4%
jan 1, 1980
16.885
+0.623
3.83%
jan 1, 1981
17.547
+0.661
3.92%
jan 1, 1982
17.822
+0.276
1.57%
jan 1, 1983
17.959
+0.137
0.77%
jan 1, 1984
18.111
+0.151
0.84%
jan 1, 1985
18.485
+0.374
2.06%
jan 1, 1986
18.754
+0.27
1.46%
jan 1, 1987
18.764
+0.01
0.05%
jan 1, 1988
18.579
-0.185
-0.99%
jan 1, 1989
18.709
+0.129
0.7%
jan 1, 1990
19.156
+0.447
2.39%
jan 1, 1991
19.463
+0.307
1.6%
jan 1, 1992
19.985
+0.523
2.69%
jan 1, 1993
20.08
+0.094
0.47%
jan 1, 1994
20.927
+0.847
4.22%
jan 1, 1995
21.241
+0.314
1.5%
jan 1, 1996
22.453
+1.212
5.7%
jan 1, 1997
22.793
+0.34
1.51%
jan 1, 1998
23.168
+0.375
1.65%
jan 1, 1999
23.505
+0.337
1.45%
jan 1, 2000
23.725
+0.22
0.93%
jan 1, 2001
24.288
+0.564
2.38%
jan 1, 2002
25.014
+0.726
2.99%
jan 1, 2003
26.113
+1.099
4.39%
jan 1, 2004
27.049
+0.936
3.58%
jan 1, 2005
28.057
+1.008
3.73%
jan 1, 2006
29.091
+1.034
3.68%
jan 1, 2007
30.17
+1.079
3.71%
jan 1, 2008
31.159
+0.989
3.28%
jan 1, 2009
33.167
+2.009
6.45%
jan 1, 2010
34.477
+1.309
3.95%
jan 1, 2011
35.727
+1.25
3.63%
jan 1, 2012
37.042
+1.315
3.68%
jan 1, 2013
38.247
+1.205
3.25%
jan 1, 2014
38.904
+0.656
1.72%
jan 1, 2015
39.819
+0.915
2.35%
Ranking of countries by current statistics by years


Comments: