29
/
en
AIzaSyAYiBZKx7MnpbEhh9jyipgxe19OcubqV5w
April 1, 2024
161701
Italy
ITA
true
2
1
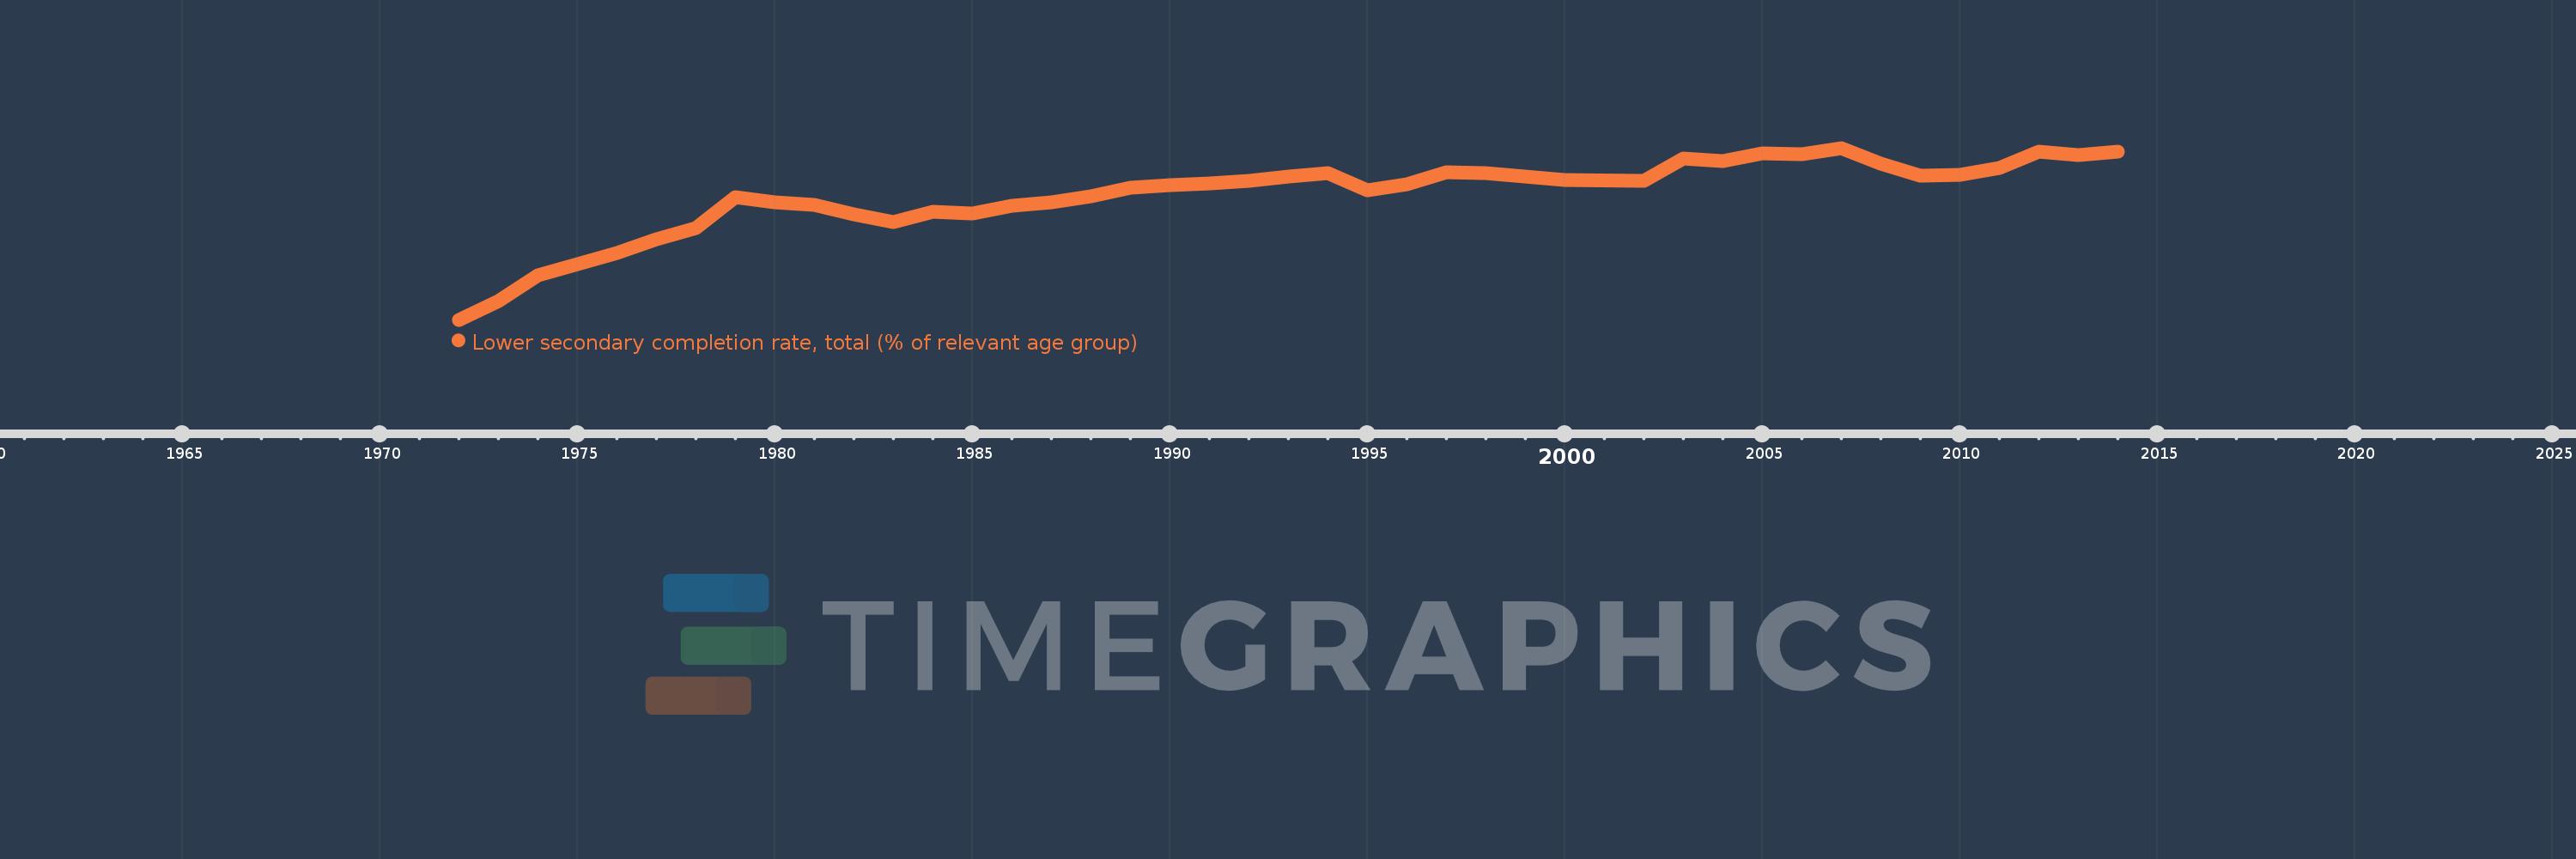
Lower secondary completion rate, total (% of relevant age group)
2014,2013,2012,2011,2010,2009,2008,2007,2006,2005,2004,2003,2002,2000,1998,1997,1996,1995,1994,1993,1992,1991,1990,1989,1988,1987,1986,1985,1984,1983,1982,1981,1980,1979,1978,1977,1976,1975,1974,1973,1972
This statistics in other country:
AfghanistanAlbaniaAlgeriaAngolaAntigua and BarbudaArab WorldArgentinaArmeniaArubaAustriaAzerbaijanBahamas, TheBahrainBangladeshBarbadosBelarusBelgiumBelizeBeninBermudaBhutanBoliviaBosnia and HerzegovinaBotswanaBrazilBritish Virgin IslandsBrunei DarussalamBulgariaBurkina FasoBurundiCabo VerdeCambodiaCameroonCaribbean small statesCentral African RepublicCentral Europe and the BalticsChadChileChinaColombiaComorosCongo, Dem. Rep.Congo, Rep.Costa RicaCote d'IvoireCroatiaCubaCyprusCzech RepublicDenmarkDjiboutiDominicaDominican RepublicEarly-demographic dividendEast Asia & PacificEast Asia & Pacific (excluding high income)East Asia & Pacific (IDA & IBRD countries)EcuadorEgypt, Arab Rep.El SalvadorEquatorial GuineaEritreaEstoniaEthiopiaEuro areaEurope & Central AsiaEurope & Central Asia (excluding high income)Europe & Central Asia (IDA & IBRD countries)European UnionFijiFinlandFragile and conflict affected situationsFranceGabonGambia, TheGeorgiaGermanyGhanaGreeceGrenadaGuatemalaGuineaGuinea-BissauGuyanaHaitiHeavily indebted poor countries (HIPC)High incomeHondurasHong Kong SAR, ChinaHungaryIBRD onlyIcelandIDA & IBRD totalIDA blendIDA onlyIDA totalIndiaIndonesiaIran, Islamic Rep.IraqIrelandIsraelItalyJamaicaJapanJordanKazakhstanKenyaKiribatiKorea, Dem. People’s Rep.Korea, Rep.KuwaitKyrgyz RepublicLao PDRLate-demographic dividendLatin America & Caribbean Latin America & Caribbean (excluding high income)Latin America & the Caribbean (IDA & IBRD countries)LatviaLeast developed countries: UN classificationLebanonLesothoLiberiaLiechtensteinLithuaniaLow & middle incomeLow incomeLower middle incomeLuxembourgMacao SAR, ChinaMacedonia, FYRMadagascarMalawiMalaysiaMaldivesMaliMaltaMarshall IslandsMauritaniaMauritiusMexicoMiddle East & North AfricaMiddle East & North Africa (excluding high income)Middle East & North Africa (IDA & IBRD countries)Middle incomeMoldovaMongoliaMontenegroMoroccoMozambiqueMyanmarNamibiaNauruNepalNetherlandsNicaraguaNigerNorwayOECD membersOmanOther small statesPacific island small statesPakistanPalauPanamaPapua New GuineaParaguayPeruPhilippinesPolandPortugalPost-demographic dividendPre-demographic dividendQatarRomaniaRussian FederationRwandaSamoaSan MarinoSao Tome and PrincipeSaudi ArabiaSenegalSerbiaSeychellesSierra LeoneSlovak RepublicSloveniaSmall statesSolomon IslandsSouth AfricaSouth AsiaSouth Asia (IDA & IBRD)South SudanSpainSri LankaSt. Kitts and NevisSt. LuciaSt. Vincent and the GrenadinesSub-Saharan Africa Sub-Saharan Africa (excluding high income)Sub-Saharan Africa (IDA & IBRD countries)SudanSurinameSwazilandSwedenSwitzerlandSyrian Arab RepublicTajikistanTanzaniaThailandTimor-LesteTogoTongaTrinidad and TobagoTunisiaTurkeyTuvaluUgandaUkraineUnited Arab EmiratesUpper middle incomeUruguayUzbekistanVanuatuVenezuela, RBVietnamWest Bank and GazaWorldYemen, Rep.ZambiaZimbabwe Timeline:
This timeline shows a graph from 1972 to 2014 of Italy. No data until 1971. Number of actual observations by date: 41.
Source name:
World Development Indicators
Source organization:
United Nations Educational, Scientific, and Cultural Organization (UNESCO) Institute for Statistics.
Categories, topics:
Education
Last updated:
apr 23, 2017
Indicators value changes by year
Minimum:
71.176
jan 1, 1972
Maximum:
103.629
jan 1, 2007
At the date of observation
Value
Absolute change
Change from previous value
jan 1, 1972
71.176
+71.176
0.0%
jan 1, 1973
74.672
+3.495
4.91%
jan 1, 1974
79.565
+4.893
6.55%
jan 1, 1975
81.622
+2.058
2.59%
jan 1, 1976
83.798
+2.176
2.67%
jan 1, 1977
86.445
+2.647
3.16%
jan 1, 1978
88.437
+1.992
2.3%
jan 1, 1979
94.409
+5.973
6.75%
jan 1, 1980
93.292
-1.118
-1.18%
jan 1, 1981
92.828
-0.463
-0.5%
jan 1, 1982
91.066
-1.762
-1.9%
jan 1, 1983
89.55
-1.516
-1.66%
jan 1, 1984
91.501
+1.951
2.18%
jan 1, 1985
91.287
-0.214
-0.23%
jan 1, 1986
92.682
+1.395
1.53%
jan 1, 1987
93.415
+0.733
0.79%
jan 1, 1988
94.427
+1.012
1.08%
jan 1, 1989
96.14
+1.713
1.81%
jan 1, 1990
96.619
+0.479
0.5%
jan 1, 1991
96.931
+0.312
0.32%
jan 1, 1992
97.463
+0.532
0.55%
jan 1, 1993
98.2
+0.737
0.76%
jan 1, 1994
98.876
+0.676
0.69%
jan 1, 1995
95.599
-3.277
-3.31%
jan 1, 1996
96.746
+1.147
1.2%
jan 1, 1997
98.968
+2.222
2.3%
jan 1, 1998
98.87
-0.098
-0.1%
jan 1, 2000
97.641
-1.229
-1.24%
jan 1, 2002
97.438
-0.203
-0.21%
jan 1, 2003
101.593
+4.155
4.26%
jan 1, 2004
101.142
-0.451
-0.44%
jan 1, 2005
102.591
+1.449
1.43%
jan 1, 2006
102.502
-0.089
-0.09%
jan 1, 2007
103.629
+1.127
1.1%
jan 1, 2008
100.729
-2.9
-2.8%
jan 1, 2009
98.34
-2.388
-2.37%
jan 1, 2010
98.575
+0.235
0.24%
jan 1, 2011
99.822
+1.247
1.27%
jan 1, 2012
102.961
+3.138
3.14%
jan 1, 2013
102.282
-0.679
-0.66%
jan 1, 2014
102.888
+0.606
0.59%
Ranking of countries by current statistics by years


Comments: