29
/
en
AIzaSyAYiBZKx7MnpbEhh9jyipgxe19OcubqV5w
April 1, 2024
77334
Bahrain
BHR
true
2
1
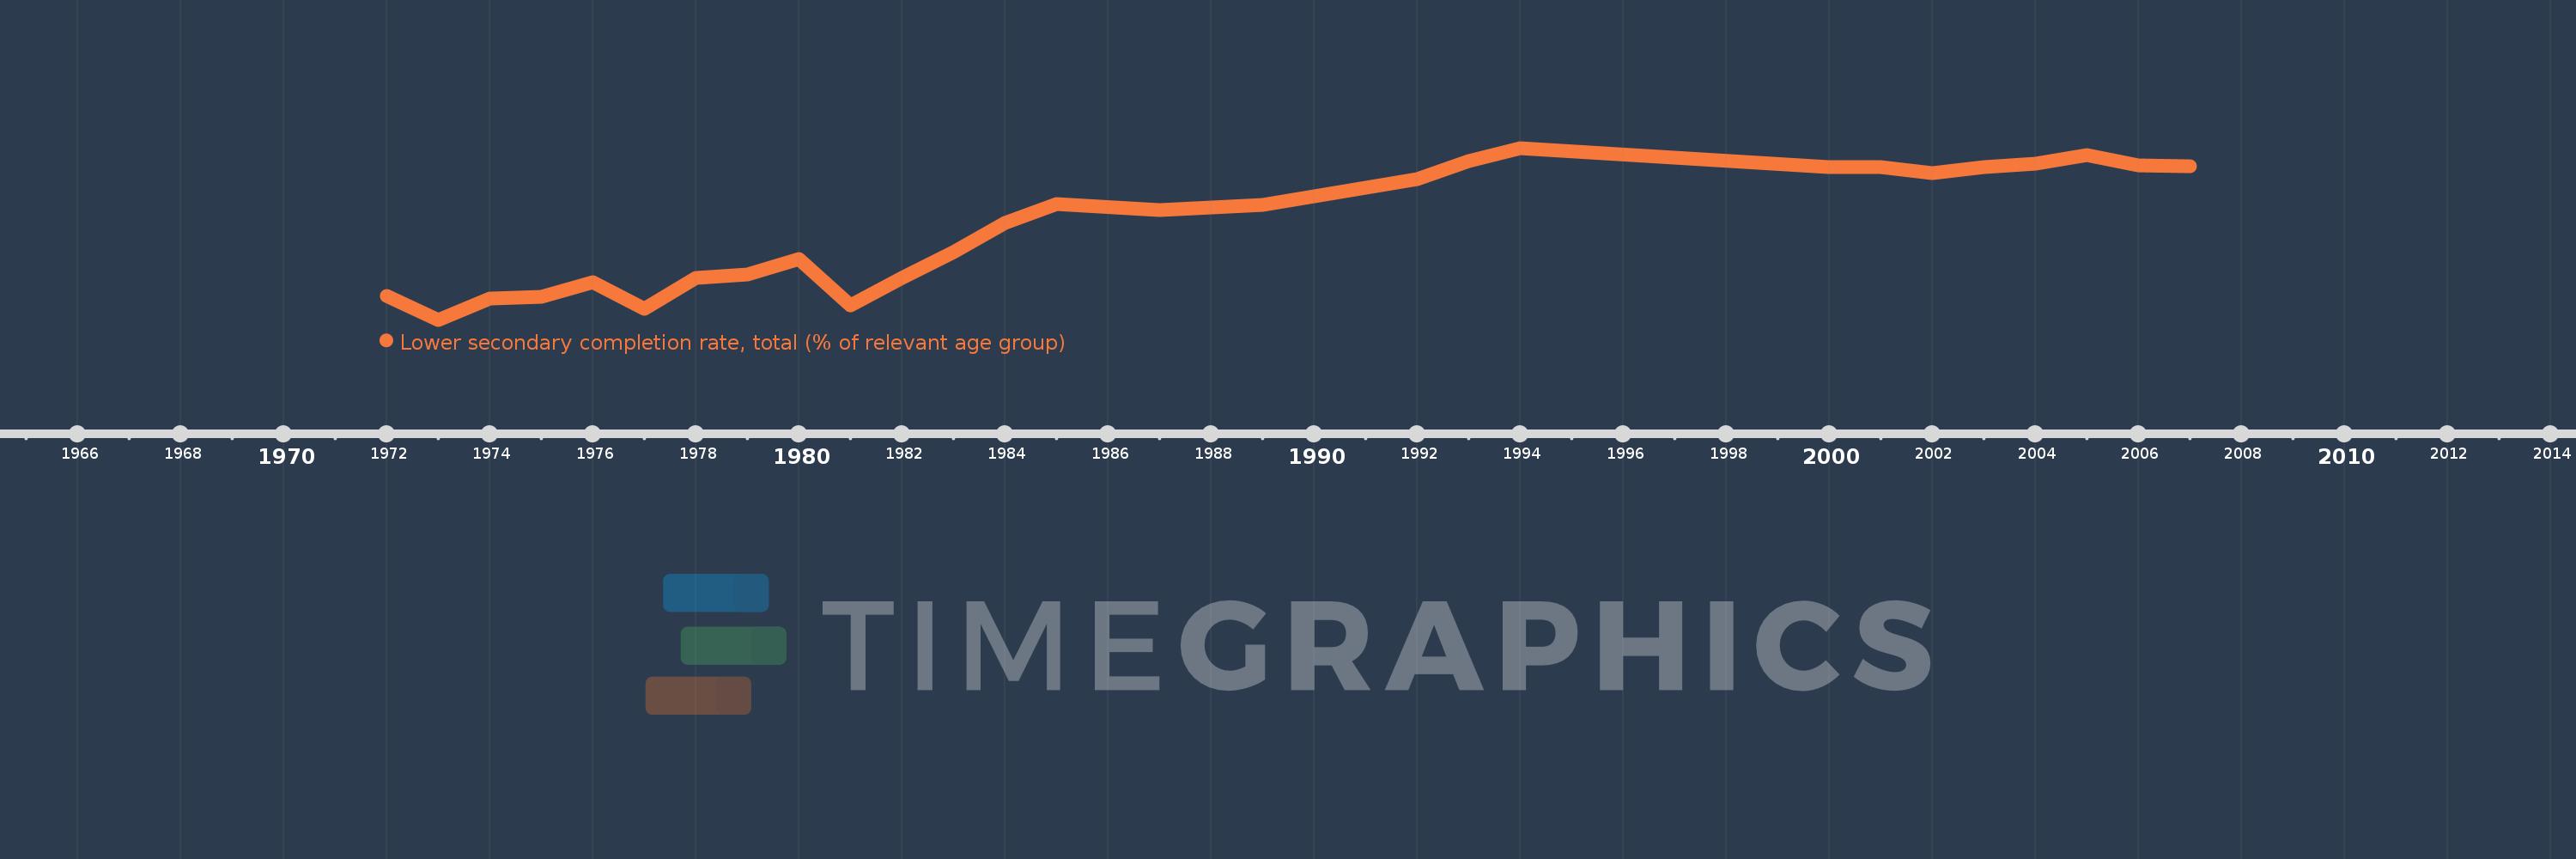
Lower secondary completion rate, total (% of relevant age group)
2007,2006,2005,2004,2003,2002,2001,2000,1994,1993,1992,1989,1987,1985,1984,1983,1982,1981,1980,1979,1978,1977,1976,1975,1974,1973,1972
This statistics in other country:
AfghanistanAlbaniaAlgeriaAngolaAntigua and BarbudaArab WorldArgentinaArmeniaArubaAustriaAzerbaijanBahamas, TheBahrainBangladeshBarbadosBelarusBelgiumBelizeBeninBermudaBhutanBoliviaBosnia and HerzegovinaBotswanaBrazilBritish Virgin IslandsBrunei DarussalamBulgariaBurkina FasoBurundiCabo VerdeCambodiaCameroonCaribbean small statesCentral African RepublicCentral Europe and the BalticsChadChileChinaColombiaComorosCongo, Dem. Rep.Congo, Rep.Costa RicaCote d'IvoireCroatiaCubaCyprusCzech RepublicDenmarkDjiboutiDominicaDominican RepublicEarly-demographic dividendEast Asia & PacificEast Asia & Pacific (excluding high income)East Asia & Pacific (IDA & IBRD countries)EcuadorEgypt, Arab Rep.El SalvadorEquatorial GuineaEritreaEstoniaEthiopiaEuro areaEurope & Central AsiaEurope & Central Asia (excluding high income)Europe & Central Asia (IDA & IBRD countries)European UnionFijiFinlandFragile and conflict affected situationsFranceGabonGambia, TheGeorgiaGermanyGhanaGreeceGrenadaGuatemalaGuineaGuinea-BissauGuyanaHaitiHeavily indebted poor countries (HIPC)High incomeHondurasHong Kong SAR, ChinaHungaryIBRD onlyIcelandIDA & IBRD totalIDA blendIDA onlyIDA totalIndiaIndonesiaIran, Islamic Rep.IraqIrelandIsraelItalyJamaicaJapanJordanKazakhstanKenyaKiribatiKorea, Dem. People’s Rep.Korea, Rep.KuwaitKyrgyz RepublicLao PDRLate-demographic dividendLatin America & Caribbean Latin America & Caribbean (excluding high income)Latin America & the Caribbean (IDA & IBRD countries)LatviaLeast developed countries: UN classificationLebanonLesothoLiberiaLiechtensteinLithuaniaLow & middle incomeLow incomeLower middle incomeLuxembourgMacao SAR, ChinaMacedonia, FYRMadagascarMalawiMalaysiaMaldivesMaliMaltaMarshall IslandsMauritaniaMauritiusMexicoMiddle East & North AfricaMiddle East & North Africa (excluding high income)Middle East & North Africa (IDA & IBRD countries)Middle incomeMoldovaMongoliaMontenegroMoroccoMozambiqueMyanmarNamibiaNauruNepalNetherlandsNicaraguaNigerNorwayOECD membersOmanOther small statesPacific island small statesPakistanPalauPanamaPapua New GuineaParaguayPeruPhilippinesPolandPortugalPost-demographic dividendPre-demographic dividendQatarRomaniaRussian FederationRwandaSamoaSan MarinoSao Tome and PrincipeSaudi ArabiaSenegalSerbiaSeychellesSierra LeoneSlovak RepublicSloveniaSmall statesSolomon IslandsSouth AfricaSouth AsiaSouth Asia (IDA & IBRD)South SudanSpainSri LankaSt. Kitts and NevisSt. LuciaSt. Vincent and the GrenadinesSub-Saharan Africa Sub-Saharan Africa (excluding high income)Sub-Saharan Africa (IDA & IBRD countries)SudanSurinameSwazilandSwedenSwitzerlandSyrian Arab RepublicTajikistanTanzaniaThailandTimor-LesteTogoTongaTrinidad and TobagoTunisiaTurkeyTuvaluUgandaUkraineUnited Arab EmiratesUpper middle incomeUruguayUzbekistanVanuatuVenezuela, RBVietnamWest Bank and GazaWorldYemen, Rep.ZambiaZimbabwe Timeline:
This timeline shows a graph from 1972 to 2007 of Bahrain. No data until 1971. Number of actual observations by date: 27.
Source name:
World Development Indicators
Source organization:
United Nations Educational, Scientific, and Cultural Organization (UNESCO) Institute for Statistics.
Categories, topics:
Education
Last updated:
apr 23, 2017
Indicators value changes by year
Minimum:
45.802
jan 1, 1973
Maximum:
102.256
jan 1, 1994
At the date of observation
Value
Absolute change
Change from previous value
jan 1, 1972
53.716
+53.716
0.0%
jan 1, 1973
45.802
-7.914
-14.73%
jan 1, 1974
52.796
+6.993
15.27%
jan 1, 1975
53.248
+0.452
0.86%
jan 1, 1976
58.105
+4.857
9.12%
jan 1, 1977
49.331
-8.774
-15.1%
jan 1, 1978
59.432
+10.101
20.48%
jan 1, 1979
60.608
+1.176
1.98%
jan 1, 1980
65.737
+5.129
8.46%
jan 1, 1981
50.472
-15.265
-23.22%
jan 1, 1982
59.515
+9.042
17.92%
jan 1, 1983
68.009
+8.494
14.27%
jan 1, 1984
77.594
+9.585
14.09%
jan 1, 1985
83.944
+6.351
8.18%
jan 1, 1987
81.88
-2.064
-2.46%
jan 1, 1989
83.615
+1.735
2.12%
jan 1, 1992
92.05
+8.435
10.09%
jan 1, 1993
97.919
+5.869
6.38%
jan 1, 1994
102.256
+4.337
4.43%
jan 1, 2000
95.901
-6.355
-6.22%
jan 1, 2001
95.888
-0.013
-0.01%
jan 1, 2002
93.918
-1.97
-2.05%
jan 1, 2003
96.097
+2.179
2.32%
jan 1, 2004
97.173
+1.076
1.12%
jan 1, 2005
99.841
+2.668
2.75%
jan 1, 2006
96.455
-3.387
-3.39%
jan 1, 2007
96.302
-0.153
-0.16%
Ranking of countries by current statistics by years


Comments: