29
/
en
AIzaSyAYiBZKx7MnpbEhh9jyipgxe19OcubqV5w
April 1, 2024
48290
Middle East & North Africa
MEA
false
2
1
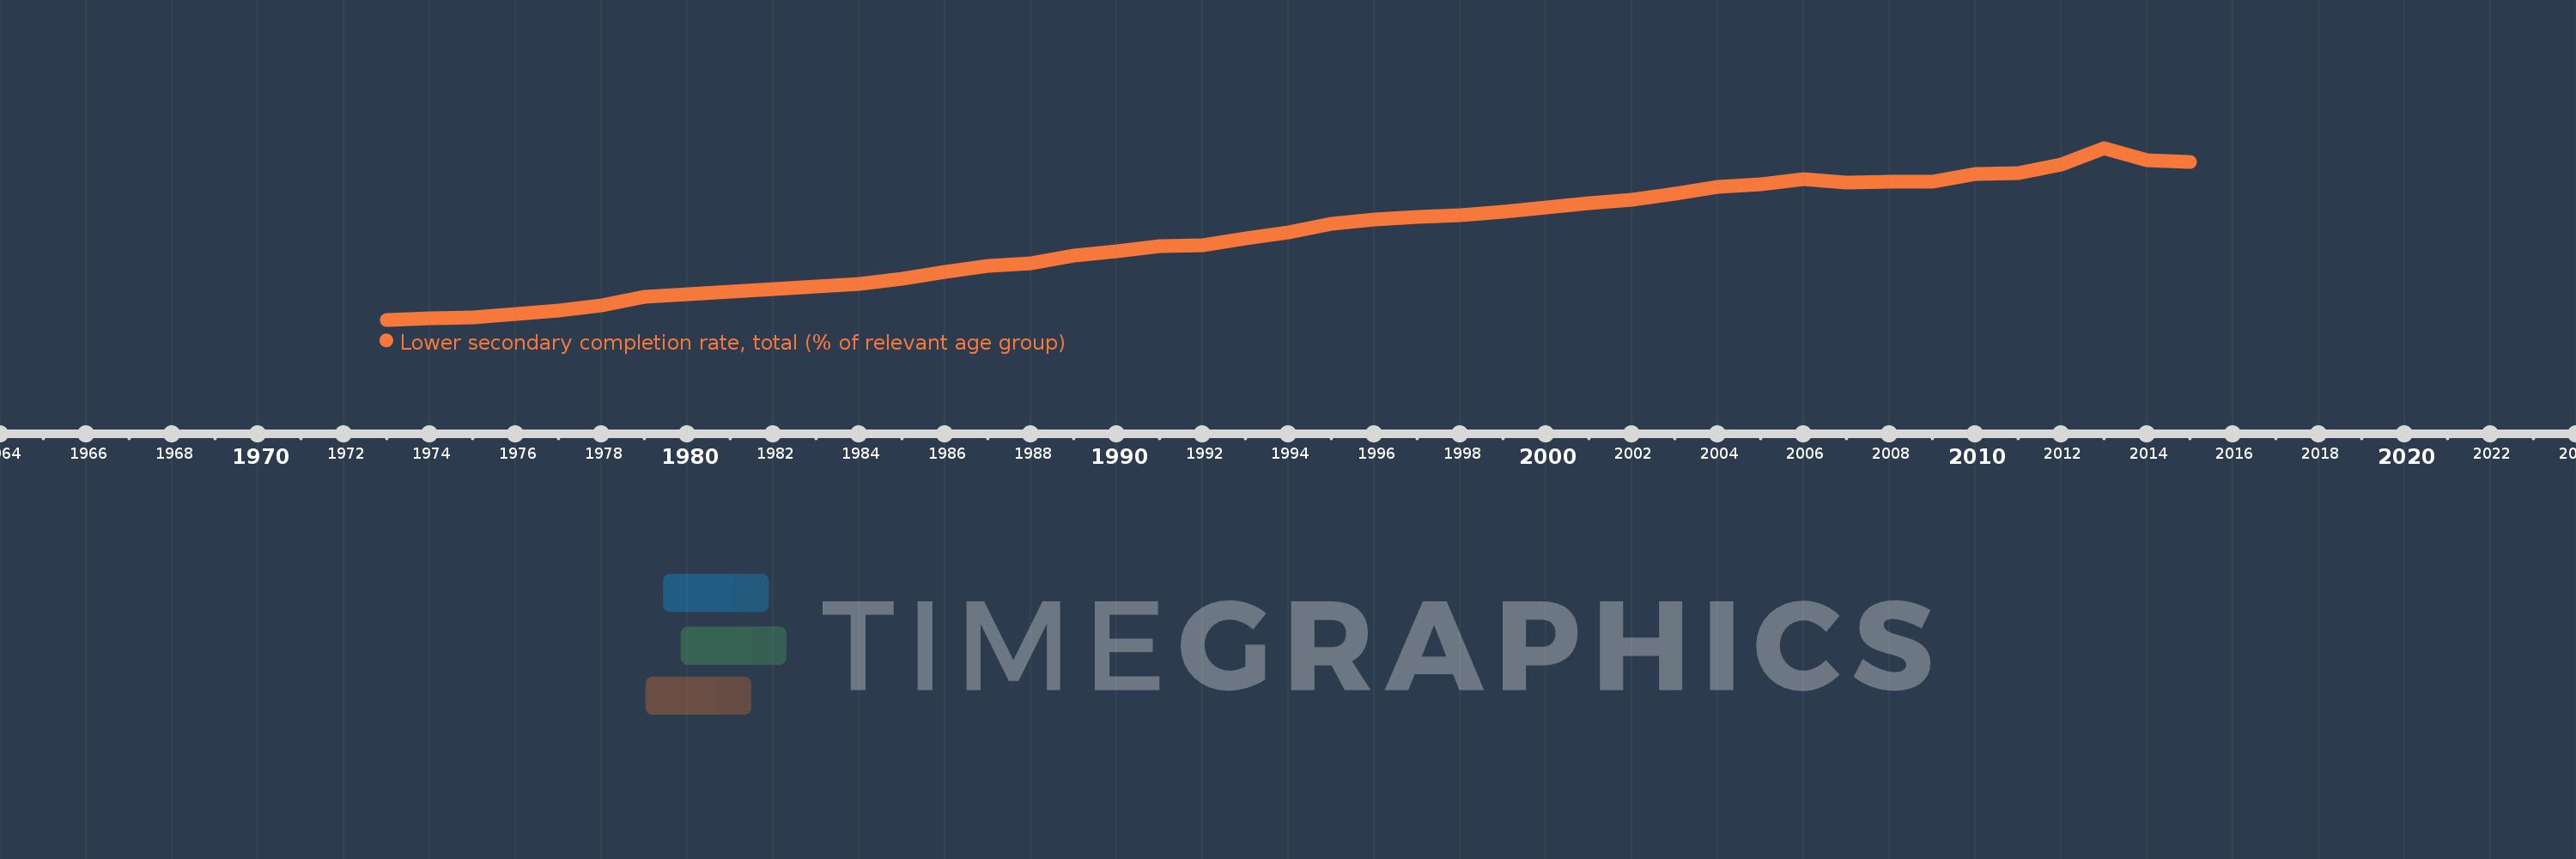
Lower secondary completion rate, total (% of relevant age group)
2015,2014,2013,2012,2011,2010,2009,2008,2007,2006,2005,2004,2003,2002,2001,2000,1999,1998,1997,1996,1995,1994,1993,1992,1991,1990,1989,1988,1987,1986,1985,1984,1983,1982,1981,1980,1979,1978,1977,1976,1975,1974,1973
This statistics in other country:
AfghanistanAlbaniaAlgeriaAngolaAntigua and BarbudaArab WorldArgentinaArmeniaArubaAustriaAzerbaijanBahamas, TheBahrainBangladeshBarbadosBelarusBelgiumBelizeBeninBermudaBhutanBoliviaBosnia and HerzegovinaBotswanaBrazilBritish Virgin IslandsBrunei DarussalamBulgariaBurkina FasoBurundiCabo VerdeCambodiaCameroonCaribbean small statesCentral African RepublicCentral Europe and the BalticsChadChileChinaColombiaComorosCongo, Dem. Rep.Congo, Rep.Costa RicaCote d'IvoireCroatiaCubaCyprusCzech RepublicDenmarkDjiboutiDominicaDominican RepublicEarly-demographic dividendEast Asia & PacificEast Asia & Pacific (excluding high income)East Asia & Pacific (IDA & IBRD countries)EcuadorEgypt, Arab Rep.El SalvadorEquatorial GuineaEritreaEstoniaEthiopiaEuro areaEurope & Central AsiaEurope & Central Asia (excluding high income)Europe & Central Asia (IDA & IBRD countries)European UnionFijiFinlandFragile and conflict affected situationsFranceGabonGambia, TheGeorgiaGermanyGhanaGreeceGrenadaGuatemalaGuineaGuinea-BissauGuyanaHaitiHeavily indebted poor countries (HIPC)High incomeHondurasHong Kong SAR, ChinaHungaryIBRD onlyIcelandIDA & IBRD totalIDA blendIDA onlyIDA totalIndiaIndonesiaIran, Islamic Rep.IraqIrelandIsraelItalyJamaicaJapanJordanKazakhstanKenyaKiribatiKorea, Dem. People’s Rep.Korea, Rep.KuwaitKyrgyz RepublicLao PDRLate-demographic dividendLatin America & Caribbean Latin America & Caribbean (excluding high income)Latin America & the Caribbean (IDA & IBRD countries)LatviaLeast developed countries: UN classificationLebanonLesothoLiberiaLiechtensteinLithuaniaLow & middle incomeLow incomeLower middle incomeLuxembourgMacao SAR, ChinaMacedonia, FYRMadagascarMalawiMalaysiaMaldivesMaliMaltaMarshall IslandsMauritaniaMauritiusMexicoMiddle East & North AfricaMiddle East & North Africa (excluding high income)Middle East & North Africa (IDA & IBRD countries)Middle incomeMoldovaMongoliaMontenegroMoroccoMozambiqueMyanmarNamibiaNauruNepalNetherlandsNicaraguaNigerNorwayOECD membersOmanOther small statesPacific island small statesPakistanPalauPanamaPapua New GuineaParaguayPeruPhilippinesPolandPortugalPost-demographic dividendPre-demographic dividendQatarRomaniaRussian FederationRwandaSamoaSan MarinoSao Tome and PrincipeSaudi ArabiaSenegalSerbiaSeychellesSierra LeoneSlovak RepublicSloveniaSmall statesSolomon IslandsSouth AfricaSouth AsiaSouth Asia (IDA & IBRD)South SudanSpainSri LankaSt. Kitts and NevisSt. LuciaSt. Vincent and the GrenadinesSub-Saharan Africa Sub-Saharan Africa (excluding high income)Sub-Saharan Africa (IDA & IBRD countries)SudanSurinameSwazilandSwedenSwitzerlandSyrian Arab RepublicTajikistanTanzaniaThailandTimor-LesteTogoTongaTrinidad and TobagoTunisiaTurkeyTuvaluUgandaUkraineUnited Arab EmiratesUpper middle incomeUruguayUzbekistanVanuatuVenezuela, RBVietnamWest Bank and GazaWorldYemen, Rep.ZambiaZimbabwe Timeline:
This timeline shows a graph from 1973 to 2015 of Middle East & North Africa. No data until 1972. Number of actual observations by date: 43.
Source name:
World Development Indicators
Source organization:
United Nations Educational, Scientific, and Cultural Organization (UNESCO) Institute for Statistics.
Categories, topics:
Education
Last updated:
apr 23, 2017
Indicators value changes by year
Minimum:
30.498
jan 1, 1973
Maximum:
79.274
jan 1, 2013
At the date of observation
Value
Absolute change
Change from previous value
jan 1, 1973
30.498
+30.498
0.0%
jan 1, 1974
31.031
+0.533
1.75%
jan 1, 1975
31.179
+0.148
0.48%
jan 1, 1976
32.201
+1.022
3.28%
jan 1, 1977
33.038
+0.836
2.6%
jan 1, 1978
34.461
+1.424
4.31%
jan 1, 1979
37.008
+2.547
7.39%
jan 1, 1980
37.756
+0.747
2.02%
jan 1, 1981
38.579
+0.824
2.18%
jan 1, 1982
39.26
+0.68
1.76%
jan 1, 1983
39.837
+0.577
1.47%
jan 1, 1984
40.761
+0.924
2.32%
jan 1, 1985
42.139
+1.378
3.38%
jan 1, 1986
43.981
+1.842
4.37%
jan 1, 1987
45.723
+1.742
3.96%
jan 1, 1988
46.432
+0.709
1.55%
jan 1, 1989
48.622
+2.19
4.72%
jan 1, 1990
49.993
+1.371
2.82%
jan 1, 1991
51.464
+1.471
2.94%
jan 1, 1992
51.625
+0.161
0.31%
jan 1, 1993
53.644
+2.02
3.91%
jan 1, 1994
55.416
+1.772
3.3%
jan 1, 1995
57.815
+2.399
4.33%
jan 1, 1996
58.882
+1.067
1.85%
jan 1, 1997
59.783
+0.901
1.53%
jan 1, 1998
60.191
+0.408
0.68%
jan 1, 1999
61.266
+1.075
1.79%
jan 1, 2000
62.328
+1.062
1.73%
jan 1, 2001
63.604
+1.276
2.05%
jan 1, 2002
64.625
+1.021
1.61%
jan 1, 2003
66.225
+1.6
2.48%
jan 1, 2004
68.203
+1.978
2.99%
jan 1, 2005
69.028
+0.826
1.21%
jan 1, 2006
70.343
+1.315
1.91%
jan 1, 2007
69.484
-0.859
-1.22%
jan 1, 2008
69.619
+0.135
0.19%
jan 1, 2009
69.713
+0.094
0.13%
jan 1, 2010
71.842
+2.129
3.05%
jan 1, 2011
72.082
+0.24
0.33%
jan 1, 2012
74.651
+2.569
3.56%
jan 1, 2013
79.274
+4.623
6.19%
jan 1, 2014
75.832
-3.442
-4.34%
jan 1, 2015
75.321
-0.511
-0.67%
Ranking of countries by current statistics by years


Comments: