29
/
en
AIzaSyAYiBZKx7MnpbEhh9jyipgxe19OcubqV5w
April 1, 2024
33612
European Union
EUU
false
2
1
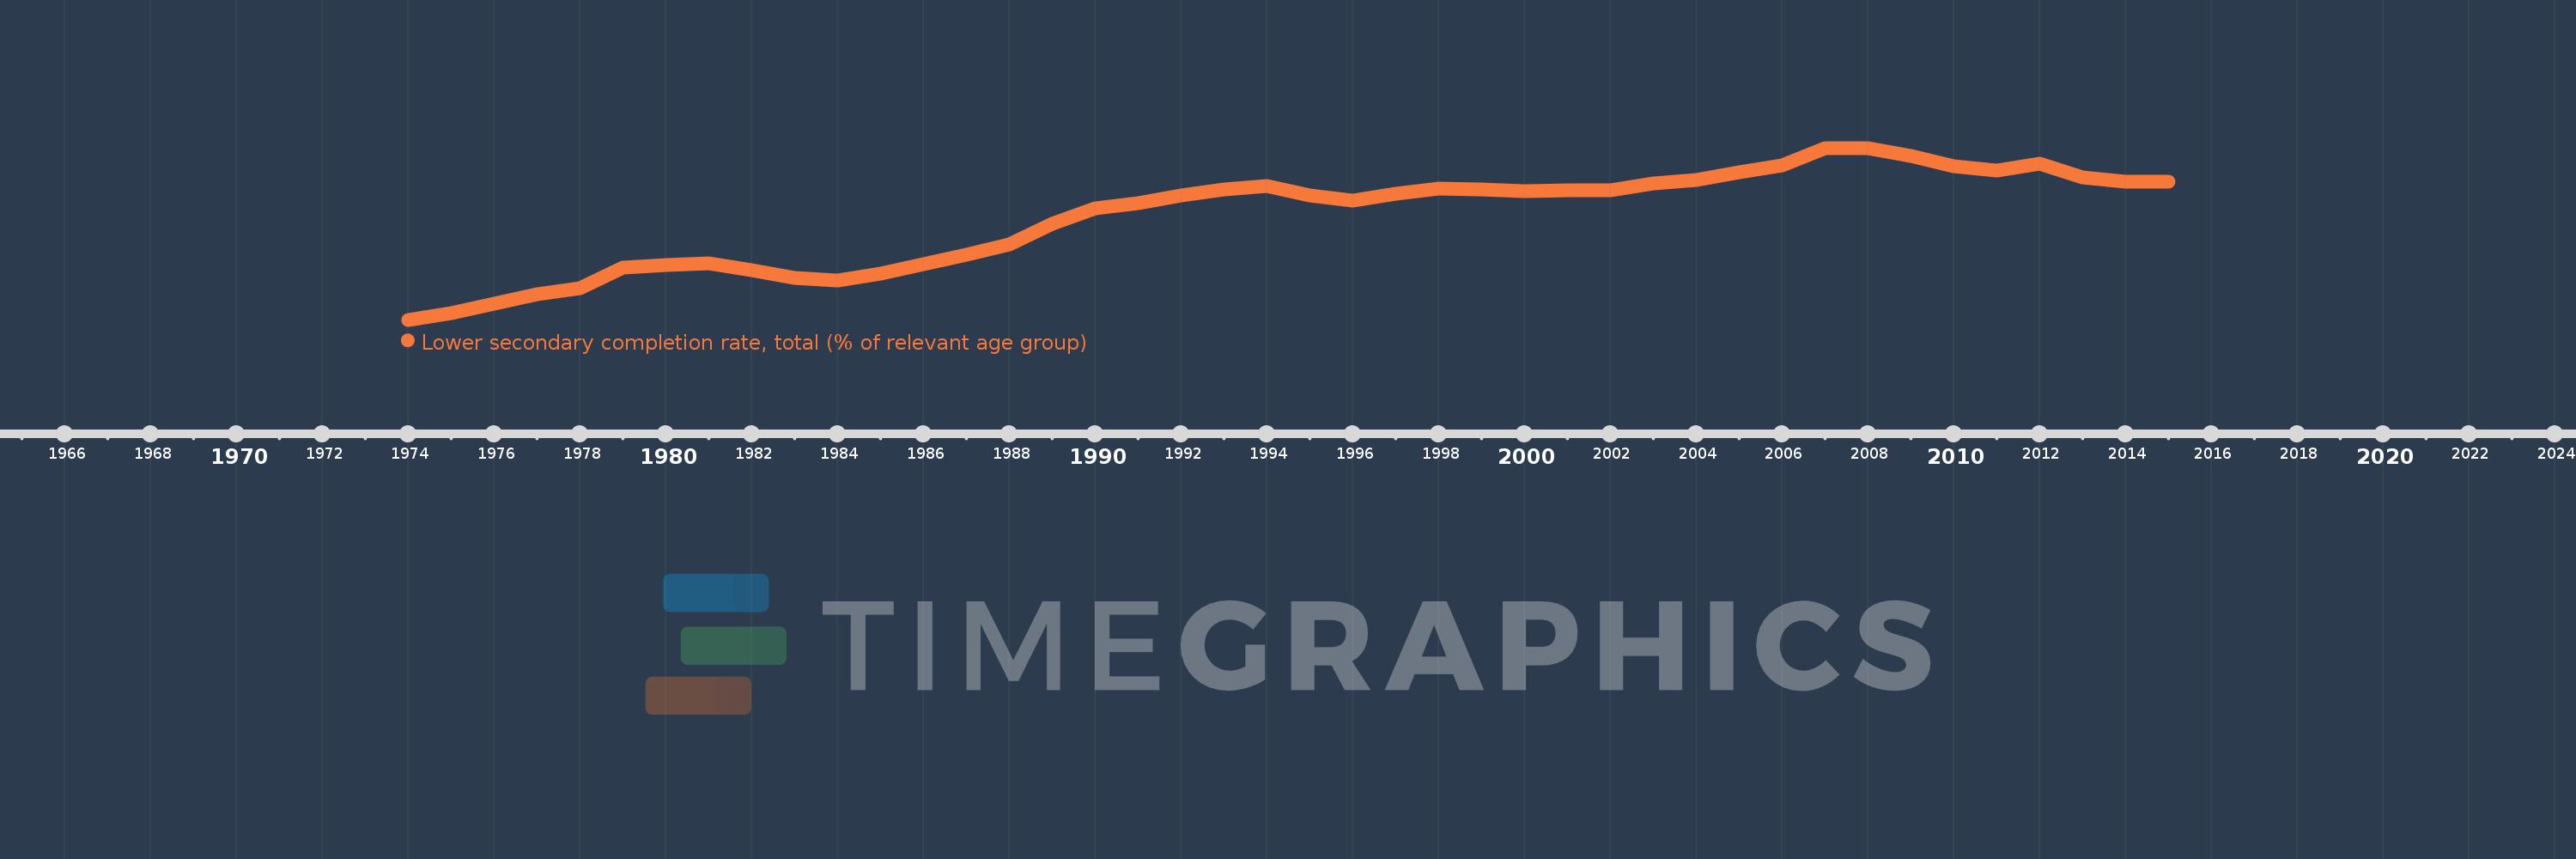
Lower secondary completion rate, total (% of relevant age group)
2015,2014,2013,2012,2011,2010,2009,2008,2007,2006,2005,2004,2003,2002,2001,2000,1999,1998,1997,1996,1995,1994,1993,1992,1991,1990,1989,1988,1987,1986,1985,1984,1983,1982,1981,1980,1979,1978,1977,1976,1975,1974
This statistics in other country:
AfghanistanAlbaniaAlgeriaAngolaAntigua and BarbudaArab WorldArgentinaArmeniaArubaAustriaAzerbaijanBahamas, TheBahrainBangladeshBarbadosBelarusBelgiumBelizeBeninBermudaBhutanBoliviaBosnia and HerzegovinaBotswanaBrazilBritish Virgin IslandsBrunei DarussalamBulgariaBurkina FasoBurundiCabo VerdeCambodiaCameroonCaribbean small statesCentral African RepublicCentral Europe and the BalticsChadChileChinaColombiaComorosCongo, Dem. Rep.Congo, Rep.Costa RicaCote d'IvoireCroatiaCubaCyprusCzech RepublicDenmarkDjiboutiDominicaDominican RepublicEarly-demographic dividendEast Asia & PacificEast Asia & Pacific (excluding high income)East Asia & Pacific (IDA & IBRD countries)EcuadorEgypt, Arab Rep.El SalvadorEquatorial GuineaEritreaEstoniaEthiopiaEuro areaEurope & Central AsiaEurope & Central Asia (excluding high income)Europe & Central Asia (IDA & IBRD countries)European UnionFijiFinlandFragile and conflict affected situationsFranceGabonGambia, TheGeorgiaGermanyGhanaGreeceGrenadaGuatemalaGuineaGuinea-BissauGuyanaHaitiHeavily indebted poor countries (HIPC)High incomeHondurasHong Kong SAR, ChinaHungaryIBRD onlyIcelandIDA & IBRD totalIDA blendIDA onlyIDA totalIndiaIndonesiaIran, Islamic Rep.IraqIrelandIsraelItalyJamaicaJapanJordanKazakhstanKenyaKiribatiKorea, Dem. People’s Rep.Korea, Rep.KuwaitKyrgyz RepublicLao PDRLate-demographic dividendLatin America & Caribbean Latin America & Caribbean (excluding high income)Latin America & the Caribbean (IDA & IBRD countries)LatviaLeast developed countries: UN classificationLebanonLesothoLiberiaLiechtensteinLithuaniaLow & middle incomeLow incomeLower middle incomeLuxembourgMacao SAR, ChinaMacedonia, FYRMadagascarMalawiMalaysiaMaldivesMaliMaltaMarshall IslandsMauritaniaMauritiusMexicoMiddle East & North AfricaMiddle East & North Africa (excluding high income)Middle East & North Africa (IDA & IBRD countries)Middle incomeMoldovaMongoliaMontenegroMoroccoMozambiqueMyanmarNamibiaNauruNepalNetherlandsNicaraguaNigerNorwayOECD membersOmanOther small statesPacific island small statesPakistanPalauPanamaPapua New GuineaParaguayPeruPhilippinesPolandPortugalPost-demographic dividendPre-demographic dividendQatarRomaniaRussian FederationRwandaSamoaSan MarinoSao Tome and PrincipeSaudi ArabiaSenegalSerbiaSeychellesSierra LeoneSlovak RepublicSloveniaSmall statesSolomon IslandsSouth AfricaSouth AsiaSouth Asia (IDA & IBRD)South SudanSpainSri LankaSt. Kitts and NevisSt. LuciaSt. Vincent and the GrenadinesSub-Saharan Africa Sub-Saharan Africa (excluding high income)Sub-Saharan Africa (IDA & IBRD countries)SudanSurinameSwazilandSwedenSwitzerlandSyrian Arab RepublicTajikistanTanzaniaThailandTimor-LesteTogoTongaTrinidad and TobagoTunisiaTurkeyTuvaluUgandaUkraineUnited Arab EmiratesUpper middle incomeUruguayUzbekistanVanuatuVenezuela, RBVietnamWest Bank and GazaWorldYemen, Rep.ZambiaZimbabwe Timeline:
This timeline shows a graph from 1974 to 2015 of European Union. No data until 1973. Number of actual observations by date: 42.
Source name:
World Development Indicators
Source organization:
United Nations Educational, Scientific, and Cultural Organization (UNESCO) Institute for Statistics.
Categories, topics:
Education
Last updated:
apr 23, 2017
Indicators value changes by year
Minimum:
76.134
jan 1, 1974
At the date of observation
Value
Absolute change
Change from previous value
jan 1, 1974
76.134
+76.134
0.0%
jan 1, 1975
76.689
+0.555
0.73%
jan 1, 1976
77.552
+0.863
1.13%
jan 1, 1977
78.407
+0.855
1.1%
jan 1, 1978
78.911
+0.504
0.64%
jan 1, 1979
80.755
+1.844
2.34%
jan 1, 1980
80.985
+0.231
0.29%
jan 1, 1981
81.08
+0.094
0.12%
jan 1, 1982
80.493
-0.587
-0.72%
jan 1, 1983
79.804
-0.689
-0.86%
jan 1, 1984
79.609
-0.195
-0.24%
jan 1, 1985
80.226
+0.617
0.77%
jan 1, 1986
81.073
+0.847
1.06%
jan 1, 1987
81.841
+0.768
0.95%
jan 1, 1988
82.811
+0.97
1.19%
jan 1, 1989
84.602
+1.791
2.16%
jan 1, 1990
85.979
+1.377
1.63%
jan 1, 1991
86.456
+0.477
0.55%
jan 1, 1992
87.081
+0.625
0.72%
jan 1, 1993
87.631
+0.55
0.63%
jan 1, 1994
87.93
+0.3
0.34%
jan 1, 1995
87.076
-0.854
-0.97%
jan 1, 1996
86.615
-0.461
-0.53%
jan 1, 1997
87.229
+0.615
0.71%
jan 1, 1998
87.698
+0.468
0.54%
jan 1, 1999
87.663
-0.035
-0.04%
jan 1, 2000
87.466
-0.197
-0.22%
jan 1, 2001
87.547
+0.081
0.09%
jan 1, 2002
87.568
+0.02
0.02%
jan 1, 2003
88.145
+0.578
0.66%
jan 1, 2004
88.48
+0.335
0.38%
jan 1, 2005
89.178
+0.698
0.79%
jan 1, 2006
89.738
+0.56
0.63%
jan 1, 2007
91.299
+1.561
1.74%
jan 1, 2008
91.3
+0.001
0.0%
jan 1, 2009
90.621
-0.679
-0.74%
jan 1, 2010
89.676
-0.945
-1.04%
jan 1, 2011
89.312
-0.363
-0.41%
jan 1, 2012
89.915
+0.602
0.67%
jan 1, 2013
88.677
-1.238
-1.38%
jan 1, 2014
88.286
-0.391
-0.44%
jan 1, 2015
88.304
+0.018
0.02%
Ranking of countries by current statistics by years


Comments: