29
/
en
AIzaSyAYiBZKx7MnpbEhh9jyipgxe19OcubqV5w
April 1, 2024
30868
Europe & Central Asia
ECS
false
2
1
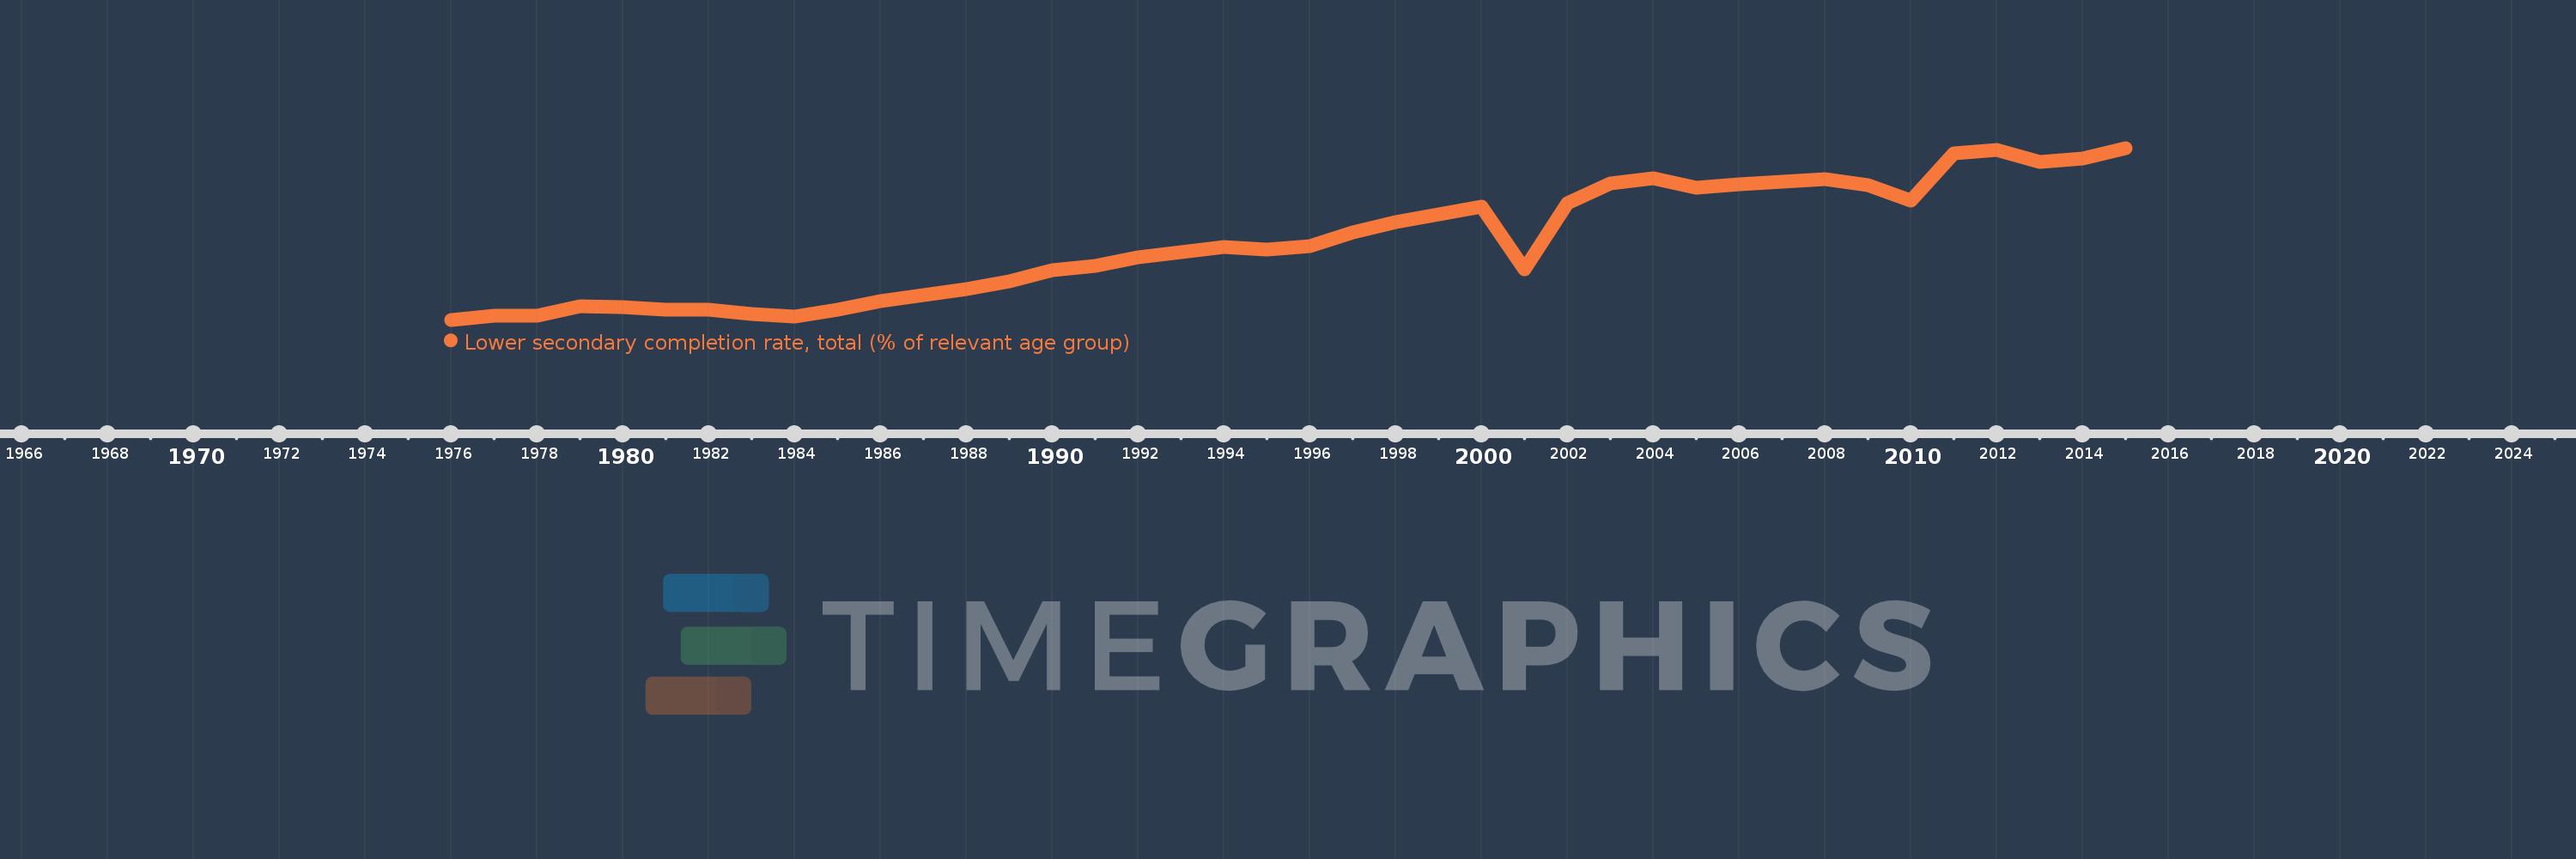
Lower secondary completion rate, total (% of relevant age group)
2015,2014,2013,2012,2011,2010,2009,2008,2007,2006,2005,2004,2003,2002,2001,2000,1999,1998,1997,1996,1995,1994,1993,1992,1991,1990,1989,1988,1987,1986,1985,1984,1983,1982,1981,1980,1979,1978,1977,1976
This statistics in other country:
AfghanistanAlbaniaAlgeriaAngolaAntigua and BarbudaArab WorldArgentinaArmeniaArubaAustriaAzerbaijanBahamas, TheBahrainBangladeshBarbadosBelarusBelgiumBelizeBeninBermudaBhutanBoliviaBosnia and HerzegovinaBotswanaBrazilBritish Virgin IslandsBrunei DarussalamBulgariaBurkina FasoBurundiCabo VerdeCambodiaCameroonCaribbean small statesCentral African RepublicCentral Europe and the BalticsChadChileChinaColombiaComorosCongo, Dem. Rep.Congo, Rep.Costa RicaCote d'IvoireCroatiaCubaCyprusCzech RepublicDenmarkDjiboutiDominicaDominican RepublicEarly-demographic dividendEast Asia & PacificEast Asia & Pacific (excluding high income)East Asia & Pacific (IDA & IBRD countries)EcuadorEgypt, Arab Rep.El SalvadorEquatorial GuineaEritreaEstoniaEthiopiaEuro areaEurope & Central AsiaEurope & Central Asia (excluding high income)Europe & Central Asia (IDA & IBRD countries)European UnionFijiFinlandFragile and conflict affected situationsFranceGabonGambia, TheGeorgiaGermanyGhanaGreeceGrenadaGuatemalaGuineaGuinea-BissauGuyanaHaitiHeavily indebted poor countries (HIPC)High incomeHondurasHong Kong SAR, ChinaHungaryIBRD onlyIcelandIDA & IBRD totalIDA blendIDA onlyIDA totalIndiaIndonesiaIran, Islamic Rep.IraqIrelandIsraelItalyJamaicaJapanJordanKazakhstanKenyaKiribatiKorea, Dem. People’s Rep.Korea, Rep.KuwaitKyrgyz RepublicLao PDRLate-demographic dividendLatin America & Caribbean Latin America & Caribbean (excluding high income)Latin America & the Caribbean (IDA & IBRD countries)LatviaLeast developed countries: UN classificationLebanonLesothoLiberiaLiechtensteinLithuaniaLow & middle incomeLow incomeLower middle incomeLuxembourgMacao SAR, ChinaMacedonia, FYRMadagascarMalawiMalaysiaMaldivesMaliMaltaMarshall IslandsMauritaniaMauritiusMexicoMiddle East & North AfricaMiddle East & North Africa (excluding high income)Middle East & North Africa (IDA & IBRD countries)Middle incomeMoldovaMongoliaMontenegroMoroccoMozambiqueMyanmarNamibiaNauruNepalNetherlandsNicaraguaNigerNorwayOECD membersOmanOther small statesPacific island small statesPakistanPalauPanamaPapua New GuineaParaguayPeruPhilippinesPolandPortugalPost-demographic dividendPre-demographic dividendQatarRomaniaRussian FederationRwandaSamoaSan MarinoSao Tome and PrincipeSaudi ArabiaSenegalSerbiaSeychellesSierra LeoneSlovak RepublicSloveniaSmall statesSolomon IslandsSouth AfricaSouth AsiaSouth Asia (IDA & IBRD)South SudanSpainSri LankaSt. Kitts and NevisSt. LuciaSt. Vincent and the GrenadinesSub-Saharan Africa Sub-Saharan Africa (excluding high income)Sub-Saharan Africa (IDA & IBRD countries)SudanSurinameSwazilandSwedenSwitzerlandSyrian Arab RepublicTajikistanTanzaniaThailandTimor-LesteTogoTongaTrinidad and TobagoTunisiaTurkeyTuvaluUgandaUkraineUnited Arab EmiratesUpper middle incomeUruguayUzbekistanVanuatuVenezuela, RBVietnamWest Bank and GazaWorldYemen, Rep.ZambiaZimbabwe Timeline:
This timeline shows a graph from 1976 to 2015 of Europe & Central Asia. No data until 1975. Number of actual observations by date: 40.
Source name:
World Development Indicators
Source organization:
United Nations Educational, Scientific, and Cultural Organization (UNESCO) Institute for Statistics.
Categories, topics:
Education
Last updated:
apr 23, 2017
Indicators value changes by year
Minimum:
78.379
jan 1, 1976
Maximum:
92.424
jan 1, 2015
At the date of observation
Value
Absolute change
Change from previous value
jan 1, 1976
78.379
+78.379
0.0%
jan 1, 1977
78.728
+0.349
0.45%
jan 1, 1978
78.684
-0.044
-0.06%
jan 1, 1979
79.479
+0.796
1.01%
jan 1, 1980
79.424
-0.055
-0.07%
jan 1, 1981
79.197
-0.227
-0.29%
jan 1, 1982
79.177
-0.021
-0.03%
jan 1, 1983
78.855
-0.321
-0.41%
jan 1, 1984
78.638
-0.217
-0.28%
jan 1, 1985
79.225
+0.587
0.75%
jan 1, 1986
79.897
+0.672
0.85%
jan 1, 1987
80.406
+0.509
0.64%
jan 1, 1988
80.879
+0.473
0.59%
jan 1, 1989
81.487
+0.608
0.75%
jan 1, 1990
82.423
+0.936
1.15%
jan 1, 1991
82.796
+0.374
0.45%
jan 1, 1992
83.474
+0.678
0.82%
jan 1, 1993
83.926
+0.451
0.54%
jan 1, 1994
84.349
+0.423
0.5%
jan 1, 1995
84.105
-0.244
-0.29%
jan 1, 1996
84.39
+0.285
0.34%
jan 1, 1997
85.545
+1.155
1.37%
jan 1, 1998
86.347
+0.803
0.94%
jan 1, 1999
87.027
+0.68
0.79%
jan 1, 2000
87.638
+0.611
0.7%
jan 1, 2001
82.52
-5.117
-5.84%
jan 1, 2002
87.897
+5.377
6.52%
jan 1, 2003
89.506
+1.609
1.83%
jan 1, 2004
89.917
+0.411
0.46%
jan 1, 2005
89.158
-0.76
-0.84%
jan 1, 2006
89.439
+0.281
0.32%
jan 1, 2007
89.647
+0.208
0.23%
jan 1, 2008
89.881
+0.234
0.26%
jan 1, 2009
89.384
-0.497
-0.55%
jan 1, 2010
88.146
-1.238
-1.39%
jan 1, 2011
91.962
+3.817
4.33%
jan 1, 2012
92.231
+0.269
0.29%
jan 1, 2013
91.266
-0.965
-1.05%
jan 1, 2014
91.561
+0.294
0.32%
jan 1, 2015
92.424
+0.863
0.94%
Ranking of countries by current statistics by years


Comments: