29
/
en
AIzaSyAYiBZKx7MnpbEhh9jyipgxe19OcubqV5w
April 1, 2024
50191
Middle East & North Africa (IDA & IBRD countries)
TMN
false
2
1
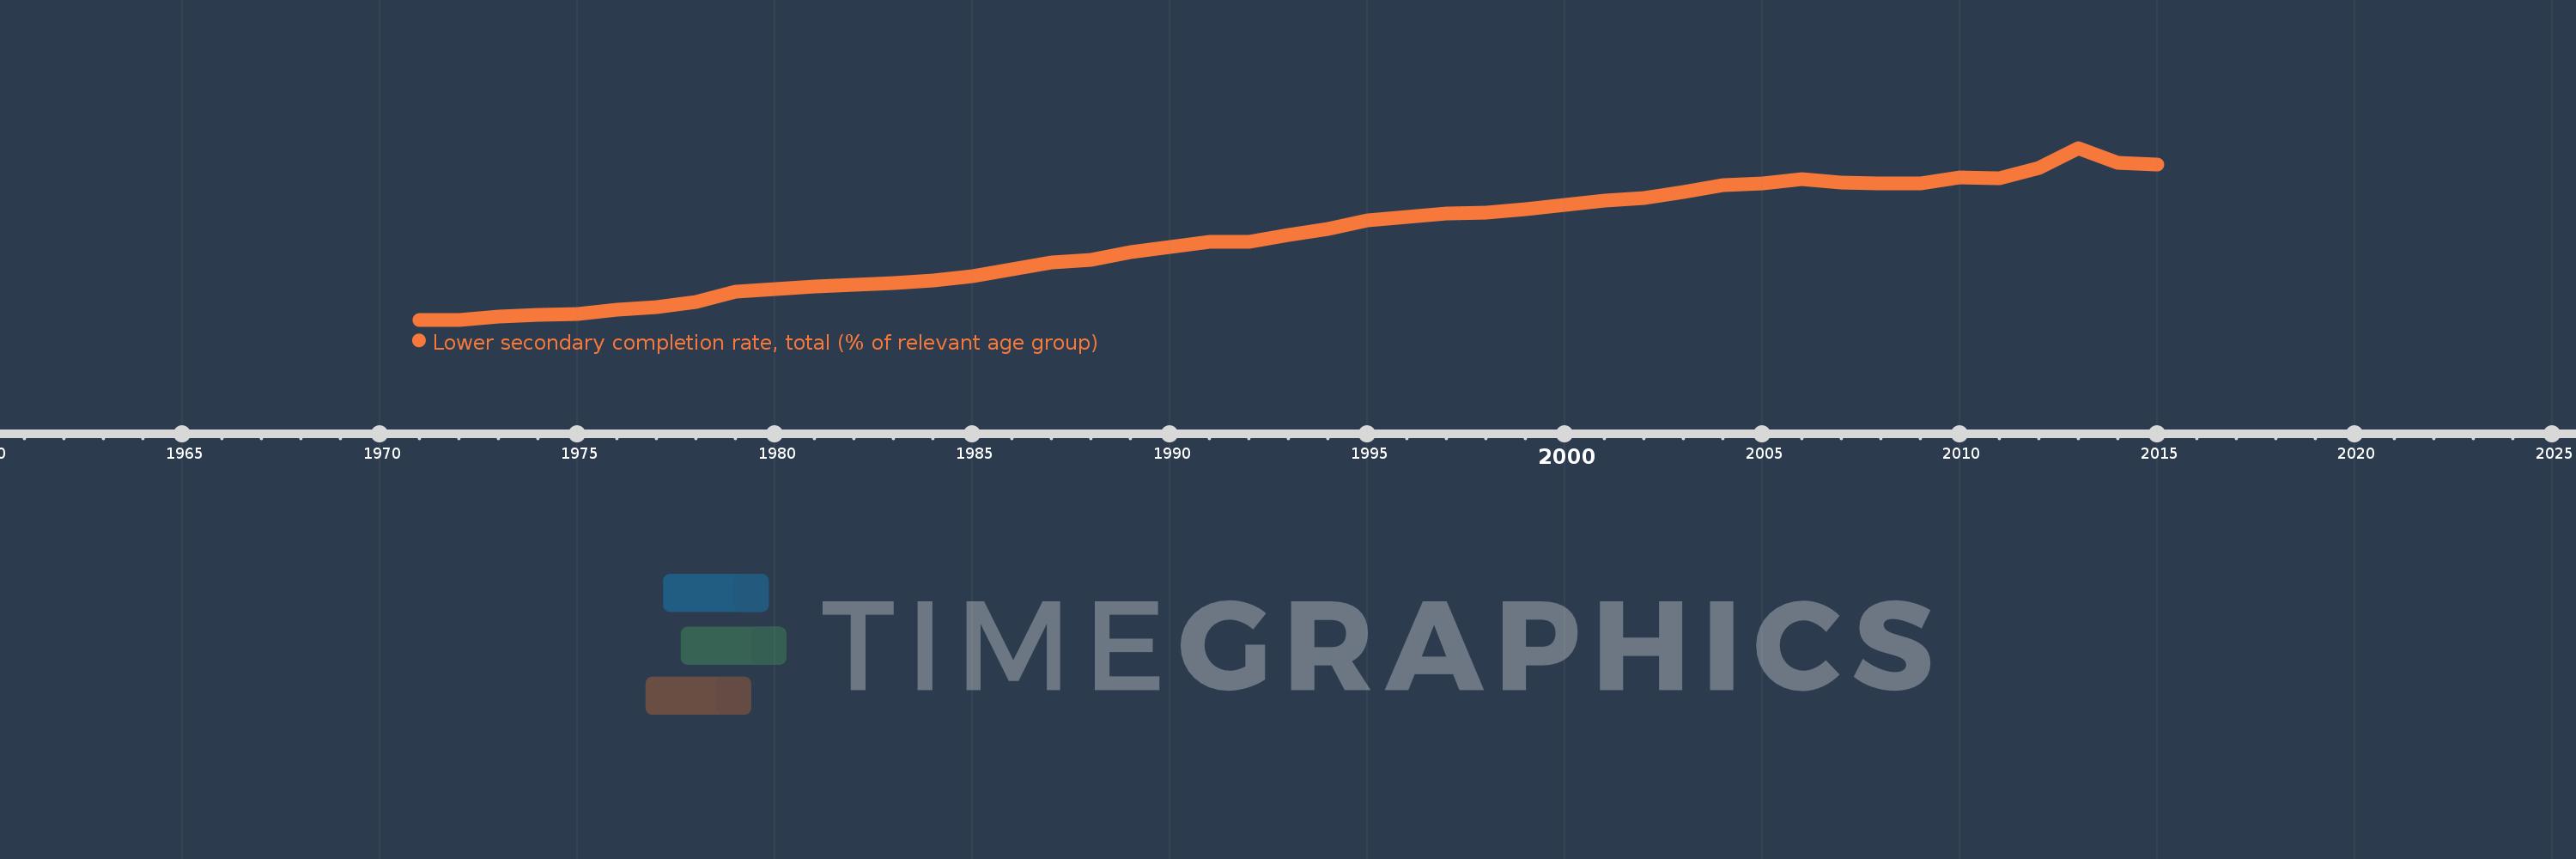
Lower secondary completion rate, total (% of relevant age group)
2015,2014,2013,2012,2011,2010,2009,2008,2007,2006,2005,2004,2003,2002,2001,2000,1999,1998,1997,1996,1995,1994,1993,1992,1991,1990,1989,1988,1987,1986,1985,1984,1983,1982,1981,1980,1979,1978,1977,1976,1975,1974,1973,1972,1971
This statistics in other country:
AfghanistanAlbaniaAlgeriaAngolaAntigua and BarbudaArab WorldArgentinaArmeniaArubaAustriaAzerbaijanBahamas, TheBahrainBangladeshBarbadosBelarusBelgiumBelizeBeninBermudaBhutanBoliviaBosnia and HerzegovinaBotswanaBrazilBritish Virgin IslandsBrunei DarussalamBulgariaBurkina FasoBurundiCabo VerdeCambodiaCameroonCaribbean small statesCentral African RepublicCentral Europe and the BalticsChadChileChinaColombiaComorosCongo, Dem. Rep.Congo, Rep.Costa RicaCote d'IvoireCroatiaCubaCyprusCzech RepublicDenmarkDjiboutiDominicaDominican RepublicEarly-demographic dividendEast Asia & PacificEast Asia & Pacific (excluding high income)East Asia & Pacific (IDA & IBRD countries)EcuadorEgypt, Arab Rep.El SalvadorEquatorial GuineaEritreaEstoniaEthiopiaEuro areaEurope & Central AsiaEurope & Central Asia (excluding high income)Europe & Central Asia (IDA & IBRD countries)European UnionFijiFinlandFragile and conflict affected situationsFranceGabonGambia, TheGeorgiaGermanyGhanaGreeceGrenadaGuatemalaGuineaGuinea-BissauGuyanaHaitiHeavily indebted poor countries (HIPC)High incomeHondurasHong Kong SAR, ChinaHungaryIBRD onlyIcelandIDA & IBRD totalIDA blendIDA onlyIDA totalIndiaIndonesiaIran, Islamic Rep.IraqIrelandIsraelItalyJamaicaJapanJordanKazakhstanKenyaKiribatiKorea, Dem. People’s Rep.Korea, Rep.KuwaitKyrgyz RepublicLao PDRLate-demographic dividendLatin America & Caribbean Latin America & Caribbean (excluding high income)Latin America & the Caribbean (IDA & IBRD countries)LatviaLeast developed countries: UN classificationLebanonLesothoLiberiaLiechtensteinLithuaniaLow & middle incomeLow incomeLower middle incomeLuxembourgMacao SAR, ChinaMacedonia, FYRMadagascarMalawiMalaysiaMaldivesMaliMaltaMarshall IslandsMauritaniaMauritiusMexicoMiddle East & North AfricaMiddle East & North Africa (excluding high income)Middle East & North Africa (IDA & IBRD countries)Middle incomeMoldovaMongoliaMontenegroMoroccoMozambiqueMyanmarNamibiaNauruNepalNetherlandsNicaraguaNigerNorwayOECD membersOmanOther small statesPacific island small statesPakistanPalauPanamaPapua New GuineaParaguayPeruPhilippinesPolandPortugalPost-demographic dividendPre-demographic dividendQatarRomaniaRussian FederationRwandaSamoaSan MarinoSao Tome and PrincipeSaudi ArabiaSenegalSerbiaSeychellesSierra LeoneSlovak RepublicSloveniaSmall statesSolomon IslandsSouth AfricaSouth AsiaSouth Asia (IDA & IBRD)South SudanSpainSri LankaSt. Kitts and NevisSt. LuciaSt. Vincent and the GrenadinesSub-Saharan Africa Sub-Saharan Africa (excluding high income)Sub-Saharan Africa (IDA & IBRD countries)SudanSurinameSwazilandSwedenSwitzerlandSyrian Arab RepublicTajikistanTanzaniaThailandTimor-LesteTogoTongaTrinidad and TobagoTunisiaTurkeyTuvaluUgandaUkraineUnited Arab EmiratesUpper middle incomeUruguayUzbekistanVanuatuVenezuela, RBVietnamWest Bank and GazaWorldYemen, Rep.ZambiaZimbabwe Timeline:
This timeline shows a graph from 1971 to 2015 of Middle East & North Africa (IDA & IBRD countries). No data until 1970. Number of actual observations by date: 45.
Source name:
World Development Indicators
Source organization:
United Nations Educational, Scientific, and Cultural Organization (UNESCO) Institute for Statistics.
Categories, topics:
Education
Last updated:
apr 23, 2017
Indicators value changes by year
Minimum:
28.732
jan 1, 1971
Maximum:
77.212
jan 1, 2013
At the date of observation
Value
Absolute change
Change from previous value
jan 1, 1971
28.732
+28.732
0.0%
jan 1, 1972
28.732
0.0
0.0%
jan 1, 1973
29.603
+0.871
3.03%
jan 1, 1974
30.175
+0.572
1.93%
jan 1, 1975
30.347
+0.172
0.57%
jan 1, 1976
31.466
+1.118
3.69%
jan 1, 1977
32.32
+0.854
2.71%
jan 1, 1978
33.842
+1.522
4.71%
jan 1, 1979
36.648
+2.806
8.29%
jan 1, 1980
37.427
+0.779
2.12%
jan 1, 1981
38.165
+0.738
1.97%
jan 1, 1982
38.636
+0.471
1.23%
jan 1, 1983
38.981
+0.346
0.89%
jan 1, 1984
39.752
+0.771
1.98%
jan 1, 1985
41.096
+1.343
3.38%
jan 1, 1986
43.004
+1.909
4.64%
jan 1, 1987
44.837
+1.833
4.26%
jan 1, 1988
45.548
+0.71
1.58%
jan 1, 1989
47.881
+2.333
5.12%
jan 1, 1990
49.208
+1.327
2.77%
jan 1, 1991
50.698
+1.49
3.03%
jan 1, 1992
50.661
-0.037
-0.07%
jan 1, 1993
52.691
+2.03
4.01%
jan 1, 1994
54.433
+1.742
3.31%
jan 1, 1995
56.863
+2.43
4.46%
jan 1, 1996
57.816
+0.953
1.68%
jan 1, 1997
58.599
+0.784
1.36%
jan 1, 1998
58.957
+0.358
0.61%
jan 1, 1999
59.99
+1.033
1.75%
jan 1, 2000
61.027
+1.037
1.73%
jan 1, 2001
62.256
+1.229
2.01%
jan 1, 2002
63.199
+0.942
1.51%
jan 1, 2003
64.75
+1.552
2.46%
jan 1, 2004
66.703
+1.952
3.01%
jan 1, 2005
67.232
+0.53
0.79%
jan 1, 2006
68.466
+1.234
1.84%
jan 1, 2007
67.453
-1.013
-1.48%
jan 1, 2008
67.227
-0.226
-0.33%
jan 1, 2009
67.134
-0.093
-0.14%
jan 1, 2010
68.875
+1.741
2.59%
jan 1, 2011
68.619
-0.256
-0.37%
jan 1, 2012
71.684
+3.064
4.47%
jan 1, 2013
77.212
+5.529
7.71%
jan 1, 2014
73.118
-4.094
-5.3%
jan 1, 2015
72.442
-0.676
-0.93%
Ranking of countries by current statistics by years


Comments: