29
/
en
AIzaSyAYiBZKx7MnpbEhh9jyipgxe19OcubqV5w
April 1, 2024
186760
Malawi
MWI
true
2
1
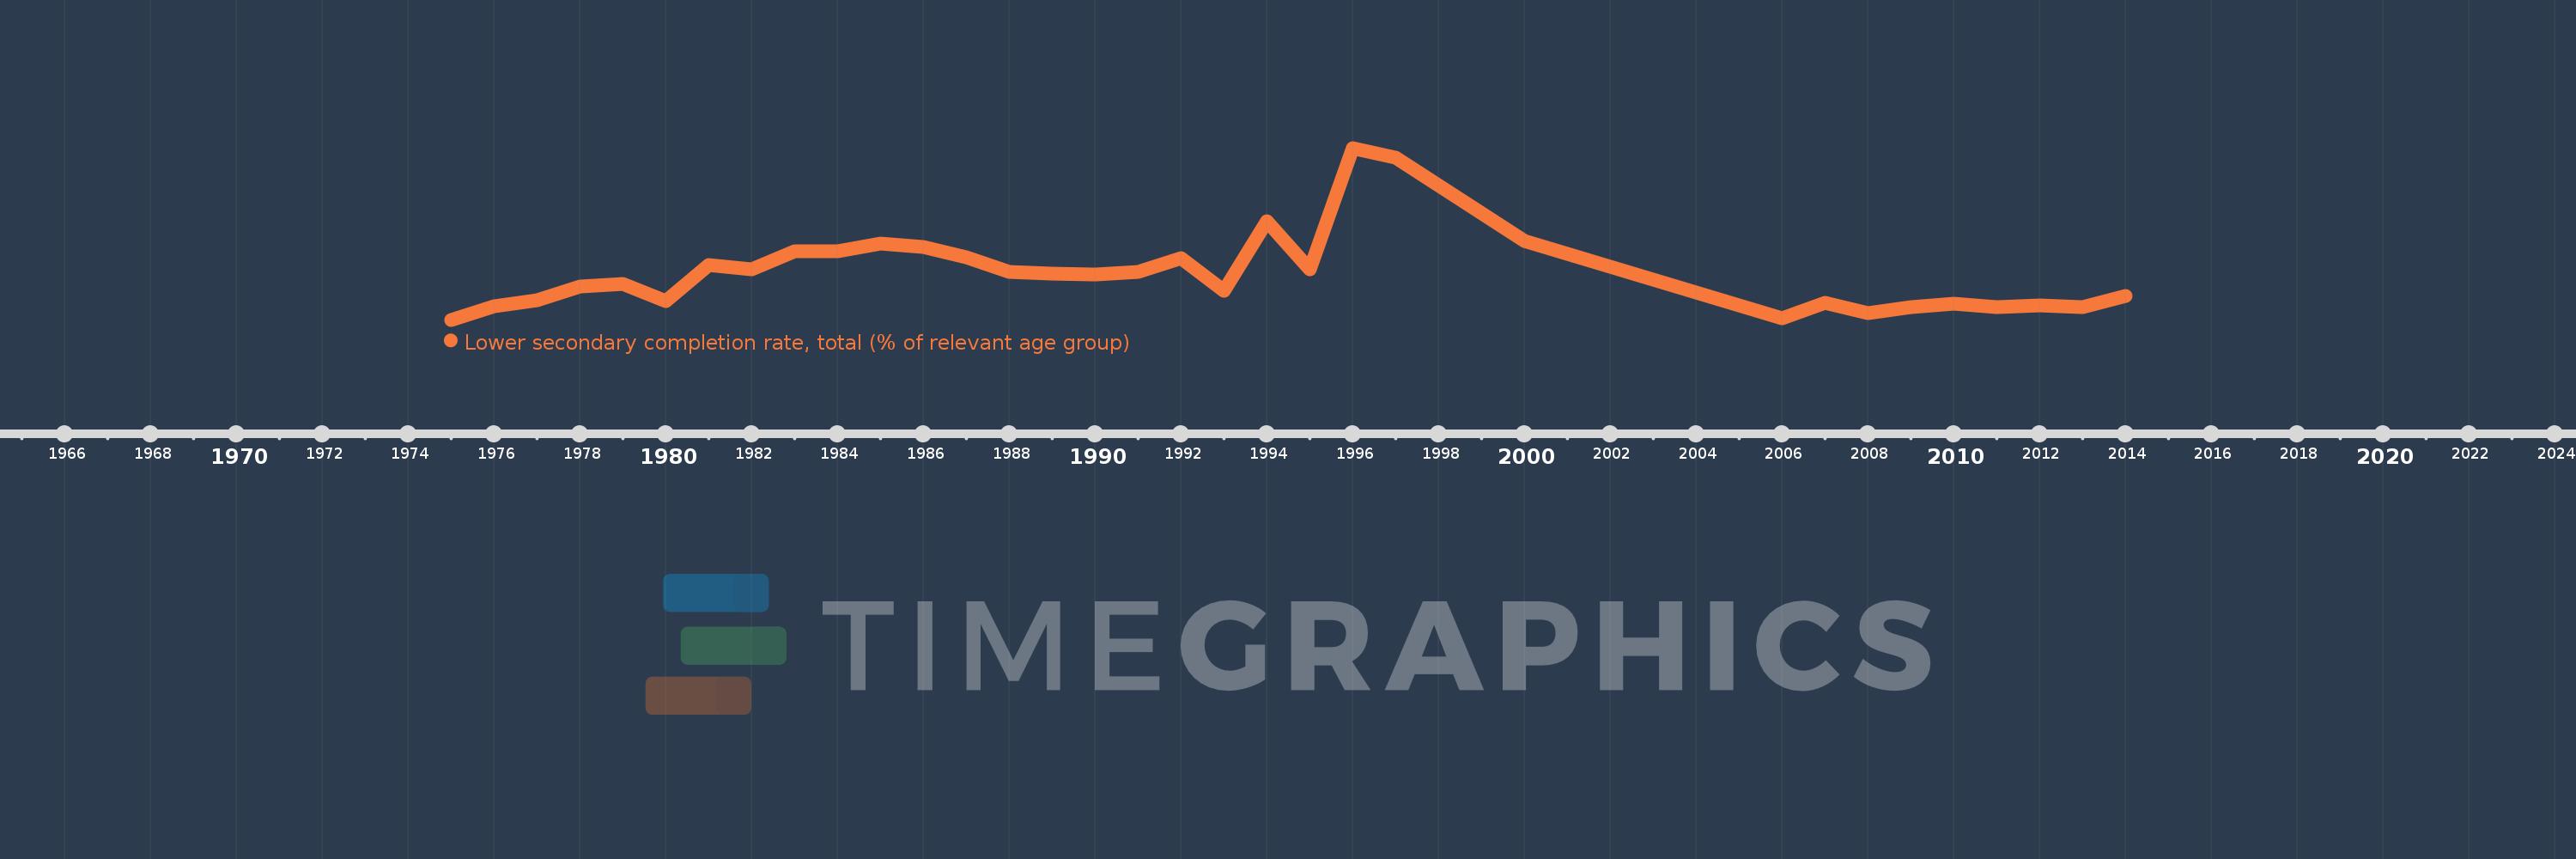
Lower secondary completion rate, total (% of relevant age group)
2014,2013,2012,2011,2010,2009,2008,2007,2006,2000,1997,1996,1995,1994,1993,1992,1991,1990,1989,1988,1987,1986,1985,1984,1983,1982,1981,1980,1979,1978,1977,1976,1975
This statistics in other country:
AfghanistanAlbaniaAlgeriaAngolaAntigua and BarbudaArab WorldArgentinaArmeniaArubaAustriaAzerbaijanBahamas, TheBahrainBangladeshBarbadosBelarusBelgiumBelizeBeninBermudaBhutanBoliviaBosnia and HerzegovinaBotswanaBrazilBritish Virgin IslandsBrunei DarussalamBulgariaBurkina FasoBurundiCabo VerdeCambodiaCameroonCaribbean small statesCentral African RepublicCentral Europe and the BalticsChadChileChinaColombiaComorosCongo, Dem. Rep.Congo, Rep.Costa RicaCote d'IvoireCroatiaCubaCyprusCzech RepublicDenmarkDjiboutiDominicaDominican RepublicEarly-demographic dividendEast Asia & PacificEast Asia & Pacific (excluding high income)East Asia & Pacific (IDA & IBRD countries)EcuadorEgypt, Arab Rep.El SalvadorEquatorial GuineaEritreaEstoniaEthiopiaEuro areaEurope & Central AsiaEurope & Central Asia (excluding high income)Europe & Central Asia (IDA & IBRD countries)European UnionFijiFinlandFragile and conflict affected situationsFranceGabonGambia, TheGeorgiaGermanyGhanaGreeceGrenadaGuatemalaGuineaGuinea-BissauGuyanaHaitiHeavily indebted poor countries (HIPC)High incomeHondurasHong Kong SAR, ChinaHungaryIBRD onlyIcelandIDA & IBRD totalIDA blendIDA onlyIDA totalIndiaIndonesiaIran, Islamic Rep.IraqIrelandIsraelItalyJamaicaJapanJordanKazakhstanKenyaKiribatiKorea, Dem. People’s Rep.Korea, Rep.KuwaitKyrgyz RepublicLao PDRLate-demographic dividendLatin America & Caribbean Latin America & Caribbean (excluding high income)Latin America & the Caribbean (IDA & IBRD countries)LatviaLeast developed countries: UN classificationLebanonLesothoLiberiaLiechtensteinLithuaniaLow & middle incomeLow incomeLower middle incomeLuxembourgMacao SAR, ChinaMacedonia, FYRMadagascarMalawiMalaysiaMaldivesMaliMaltaMarshall IslandsMauritaniaMauritiusMexicoMiddle East & North AfricaMiddle East & North Africa (excluding high income)Middle East & North Africa (IDA & IBRD countries)Middle incomeMoldovaMongoliaMontenegroMoroccoMozambiqueMyanmarNamibiaNauruNepalNetherlandsNicaraguaNigerNorwayOECD membersOmanOther small statesPacific island small statesPakistanPalauPanamaPapua New GuineaParaguayPeruPhilippinesPolandPortugalPost-demographic dividendPre-demographic dividendQatarRomaniaRussian FederationRwandaSamoaSan MarinoSao Tome and PrincipeSaudi ArabiaSenegalSerbiaSeychellesSierra LeoneSlovak RepublicSloveniaSmall statesSolomon IslandsSouth AfricaSouth AsiaSouth Asia (IDA & IBRD)South SudanSpainSri LankaSt. Kitts and NevisSt. LuciaSt. Vincent and the GrenadinesSub-Saharan Africa Sub-Saharan Africa (excluding high income)Sub-Saharan Africa (IDA & IBRD countries)SudanSurinameSwazilandSwedenSwitzerlandSyrian Arab RepublicTajikistanTanzaniaThailandTimor-LesteTogoTongaTrinidad and TobagoTunisiaTurkeyTuvaluUgandaUkraineUnited Arab EmiratesUpper middle incomeUruguayUzbekistanVanuatuVenezuela, RBVietnamWest Bank and GazaWorldYemen, Rep.ZambiaZimbabwe Timeline:
This timeline shows a graph from 1975 to 2014 of Malawi. No data until 1974. Number of actual observations by date: 33.
Source name:
World Development Indicators
Source organization:
United Nations Educational, Scientific, and Cultural Organization (UNESCO) Institute for Statistics.
Categories, topics:
Education
Last updated:
apr 23, 2017
Indicators value changes by year
Minimum:
16.509
jan 1, 1975
Maximum:
49.672
jan 1, 1996
At the date of observation
Value
Absolute change
Change from previous value
jan 1, 1975
16.509
+16.509
0.0%
jan 1, 1976
19.12
+2.611
15.82%
jan 1, 1977
20.349
+1.229
6.43%
jan 1, 1978
23.004
+2.654
13.04%
jan 1, 1979
23.481
+0.477
2.08%
jan 1, 1980
20.183
-3.298
-14.05%
jan 1, 1981
26.992
+6.809
33.74%
jan 1, 1982
26.203
-0.789
-2.92%
jan 1, 1983
29.653
+3.45
13.17%
jan 1, 1984
29.726
+0.073
0.25%
jan 1, 1985
31.135
+1.409
4.74%
jan 1, 1986
30.502
-0.633
-2.03%
jan 1, 1987
28.495
-2.007
-6.58%
jan 1, 1988
25.707
-2.788
-9.79%
jan 1, 1989
25.364
-0.343
-1.33%
jan 1, 1990
25.296
-0.068
-0.27%
jan 1, 1991
25.762
+0.466
1.84%
jan 1, 1992
28.378
+2.617
10.16%
jan 1, 1993
22.042
-6.336
-22.33%
jan 1, 1994
35.51
+13.468
61.1%
jan 1, 1995
26.171
-9.339
-26.3%
jan 1, 1996
49.672
+23.501
89.8%
jan 1, 1997
47.729
-1.943
-3.91%
jan 1, 2000
31.658
-16.071
-33.67%
jan 1, 2006
16.736
-14.922
-47.14%
jan 1, 2007
19.695
+2.959
17.68%
jan 1, 2008
17.799
-1.896
-9.63%
jan 1, 2009
18.957
+1.157
6.5%
jan 1, 2010
19.651
+0.694
3.66%
jan 1, 2011
18.954
-0.697
-3.55%
jan 1, 2012
19.338
+0.384
2.03%
jan 1, 2013
18.915
-0.423
-2.19%
jan 1, 2014
21.039
+2.124
11.23%
Ranking of countries by current statistics by years


Comments: