29
/
en
AIzaSyAYiBZKx7MnpbEhh9jyipgxe19OcubqV5w
April 1, 2024
136974
Gambia, The
GMB
true
2
1
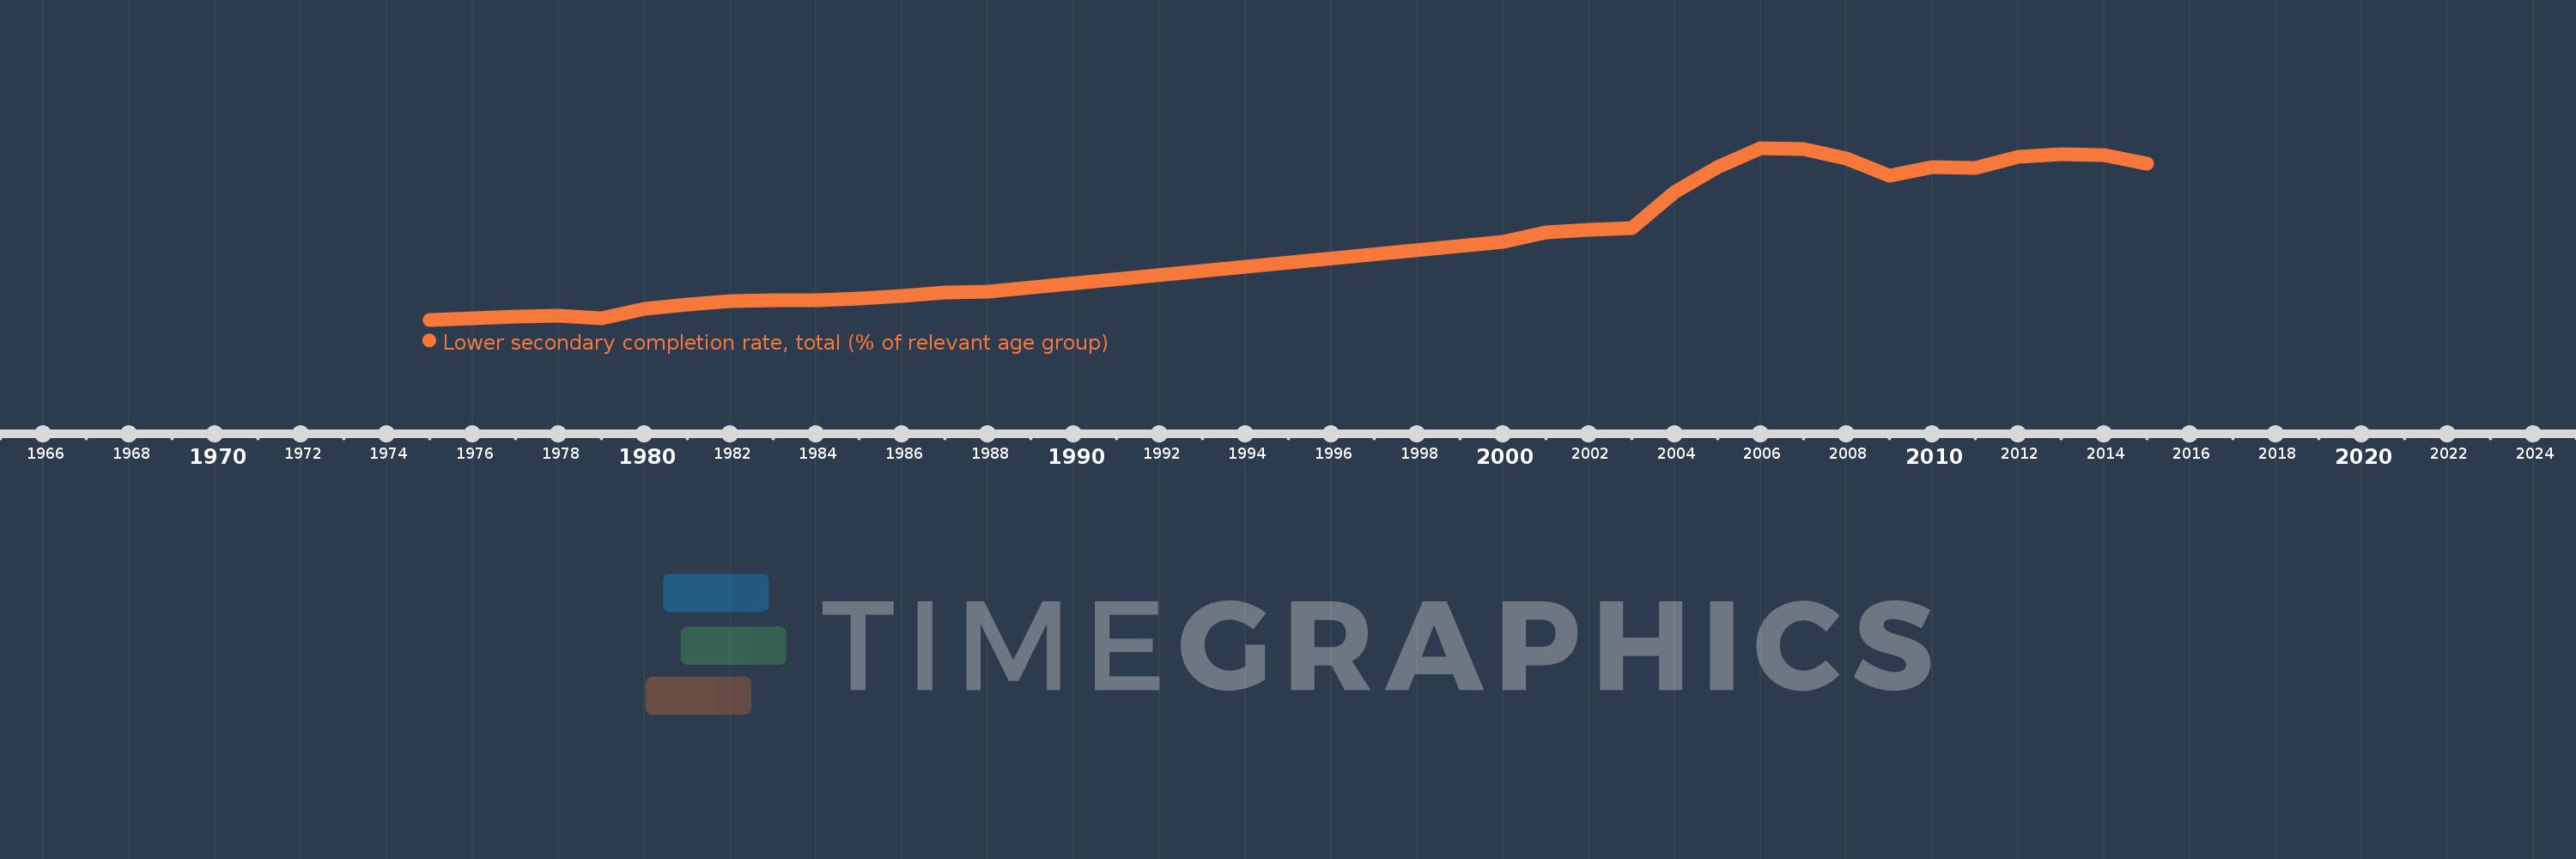
Lower secondary completion rate, total (% of relevant age group)
2015,2014,2013,2012,2011,2010,2009,2008,2007,2006,2005,2004,2003,2002,2001,2000,1988,1987,1986,1985,1984,1983,1982,1981,1980,1979,1978,1977,1975
This statistics in other country:
AfghanistanAlbaniaAlgeriaAngolaAntigua and BarbudaArab WorldArgentinaArmeniaArubaAustriaAzerbaijanBahamas, TheBahrainBangladeshBarbadosBelarusBelgiumBelizeBeninBermudaBhutanBoliviaBosnia and HerzegovinaBotswanaBrazilBritish Virgin IslandsBrunei DarussalamBulgariaBurkina FasoBurundiCabo VerdeCambodiaCameroonCaribbean small statesCentral African RepublicCentral Europe and the BalticsChadChileChinaColombiaComorosCongo, Dem. Rep.Congo, Rep.Costa RicaCote d'IvoireCroatiaCubaCyprusCzech RepublicDenmarkDjiboutiDominicaDominican RepublicEarly-demographic dividendEast Asia & PacificEast Asia & Pacific (excluding high income)East Asia & Pacific (IDA & IBRD countries)EcuadorEgypt, Arab Rep.El SalvadorEquatorial GuineaEritreaEstoniaEthiopiaEuro areaEurope & Central AsiaEurope & Central Asia (excluding high income)Europe & Central Asia (IDA & IBRD countries)European UnionFijiFinlandFragile and conflict affected situationsFranceGabonGambia, TheGeorgiaGermanyGhanaGreeceGrenadaGuatemalaGuineaGuinea-BissauGuyanaHaitiHeavily indebted poor countries (HIPC)High incomeHondurasHong Kong SAR, ChinaHungaryIBRD onlyIcelandIDA & IBRD totalIDA blendIDA onlyIDA totalIndiaIndonesiaIran, Islamic Rep.IraqIrelandIsraelItalyJamaicaJapanJordanKazakhstanKenyaKiribatiKorea, Dem. People’s Rep.Korea, Rep.KuwaitKyrgyz RepublicLao PDRLate-demographic dividendLatin America & Caribbean Latin America & Caribbean (excluding high income)Latin America & the Caribbean (IDA & IBRD countries)LatviaLeast developed countries: UN classificationLebanonLesothoLiberiaLiechtensteinLithuaniaLow & middle incomeLow incomeLower middle incomeLuxembourgMacao SAR, ChinaMacedonia, FYRMadagascarMalawiMalaysiaMaldivesMaliMaltaMarshall IslandsMauritaniaMauritiusMexicoMiddle East & North AfricaMiddle East & North Africa (excluding high income)Middle East & North Africa (IDA & IBRD countries)Middle incomeMoldovaMongoliaMontenegroMoroccoMozambiqueMyanmarNamibiaNauruNepalNetherlandsNicaraguaNigerNorwayOECD membersOmanOther small statesPacific island small statesPakistanPalauPanamaPapua New GuineaParaguayPeruPhilippinesPolandPortugalPost-demographic dividendPre-demographic dividendQatarRomaniaRussian FederationRwandaSamoaSan MarinoSao Tome and PrincipeSaudi ArabiaSenegalSerbiaSeychellesSierra LeoneSlovak RepublicSloveniaSmall statesSolomon IslandsSouth AfricaSouth AsiaSouth Asia (IDA & IBRD)South SudanSpainSri LankaSt. Kitts and NevisSt. LuciaSt. Vincent and the GrenadinesSub-Saharan Africa Sub-Saharan Africa (excluding high income)Sub-Saharan Africa (IDA & IBRD countries)SudanSurinameSwazilandSwedenSwitzerlandSyrian Arab RepublicTajikistanTanzaniaThailandTimor-LesteTogoTongaTrinidad and TobagoTunisiaTurkeyTuvaluUgandaUkraineUnited Arab EmiratesUpper middle incomeUruguayUzbekistanVanuatuVenezuela, RBVietnamWest Bank and GazaWorldYemen, Rep.ZambiaZimbabwe Timeline:
This timeline shows a graph from 1975 to 2015 of Gambia, The. No data until 1974. Number of actual observations by date: 29.
Source name:
World Development Indicators
Source organization:
United Nations Educational, Scientific, and Cultural Organization (UNESCO) Institute for Statistics.
Categories, topics:
Education
Last updated:
apr 23, 2017
Indicators value changes by year
Minimum:
11.807
jan 1, 1975
Maximum:
66.528
jan 1, 2006
At the date of observation
Value
Absolute change
Change from previous value
jan 1, 1975
11.807
+11.807
0.0%
jan 1, 1977
12.729
+0.922
7.81%
jan 1, 1978
13.174
+0.444
3.49%
jan 1, 1979
12.198
-0.976
-7.41%
jan 1, 1980
15.311
+3.113
25.52%
jan 1, 1981
16.523
+1.212
7.92%
jan 1, 1982
17.824
+1.301
7.88%
jan 1, 1983
18.008
+0.183
1.03%
jan 1, 1984
18.126
+0.118
0.66%
jan 1, 1985
18.456
+0.33
1.82%
jan 1, 1986
19.347
+0.891
4.83%
jan 1, 1987
20.348
+1.0
5.17%
jan 1, 1988
20.644
+0.297
1.46%
jan 1, 2000
36.558
+15.914
77.09%
jan 1, 2001
39.63
+3.072
8.4%
jan 1, 2002
40.393
+0.763
1.92%
jan 1, 2003
40.969
+0.576
1.43%
jan 1, 2004
52.535
+11.566
28.23%
jan 1, 2005
60.524
+7.989
15.21%
jan 1, 2006
66.528
+6.004
9.92%
jan 1, 2007
66.152
-0.377
-0.57%
jan 1, 2008
63.201
-2.95
-4.46%
jan 1, 2009
57.751
-5.45
-8.62%
jan 1, 2010
60.524
+2.773
4.8%
jan 1, 2011
60.105
-0.419
-0.69%
jan 1, 2012
63.712
+3.607
6.0%
jan 1, 2013
64.609
+0.897
1.41%
jan 1, 2014
64.279
-0.33
-0.51%
jan 1, 2015
61.546
-2.733
-4.25%
Ranking of countries by current statistics by years


Comments: