29
/
en
AIzaSyAYiBZKx7MnpbEhh9jyipgxe19OcubqV5w
April 1, 2024
92579
Brunei Darussalam
BRN
true
2
1
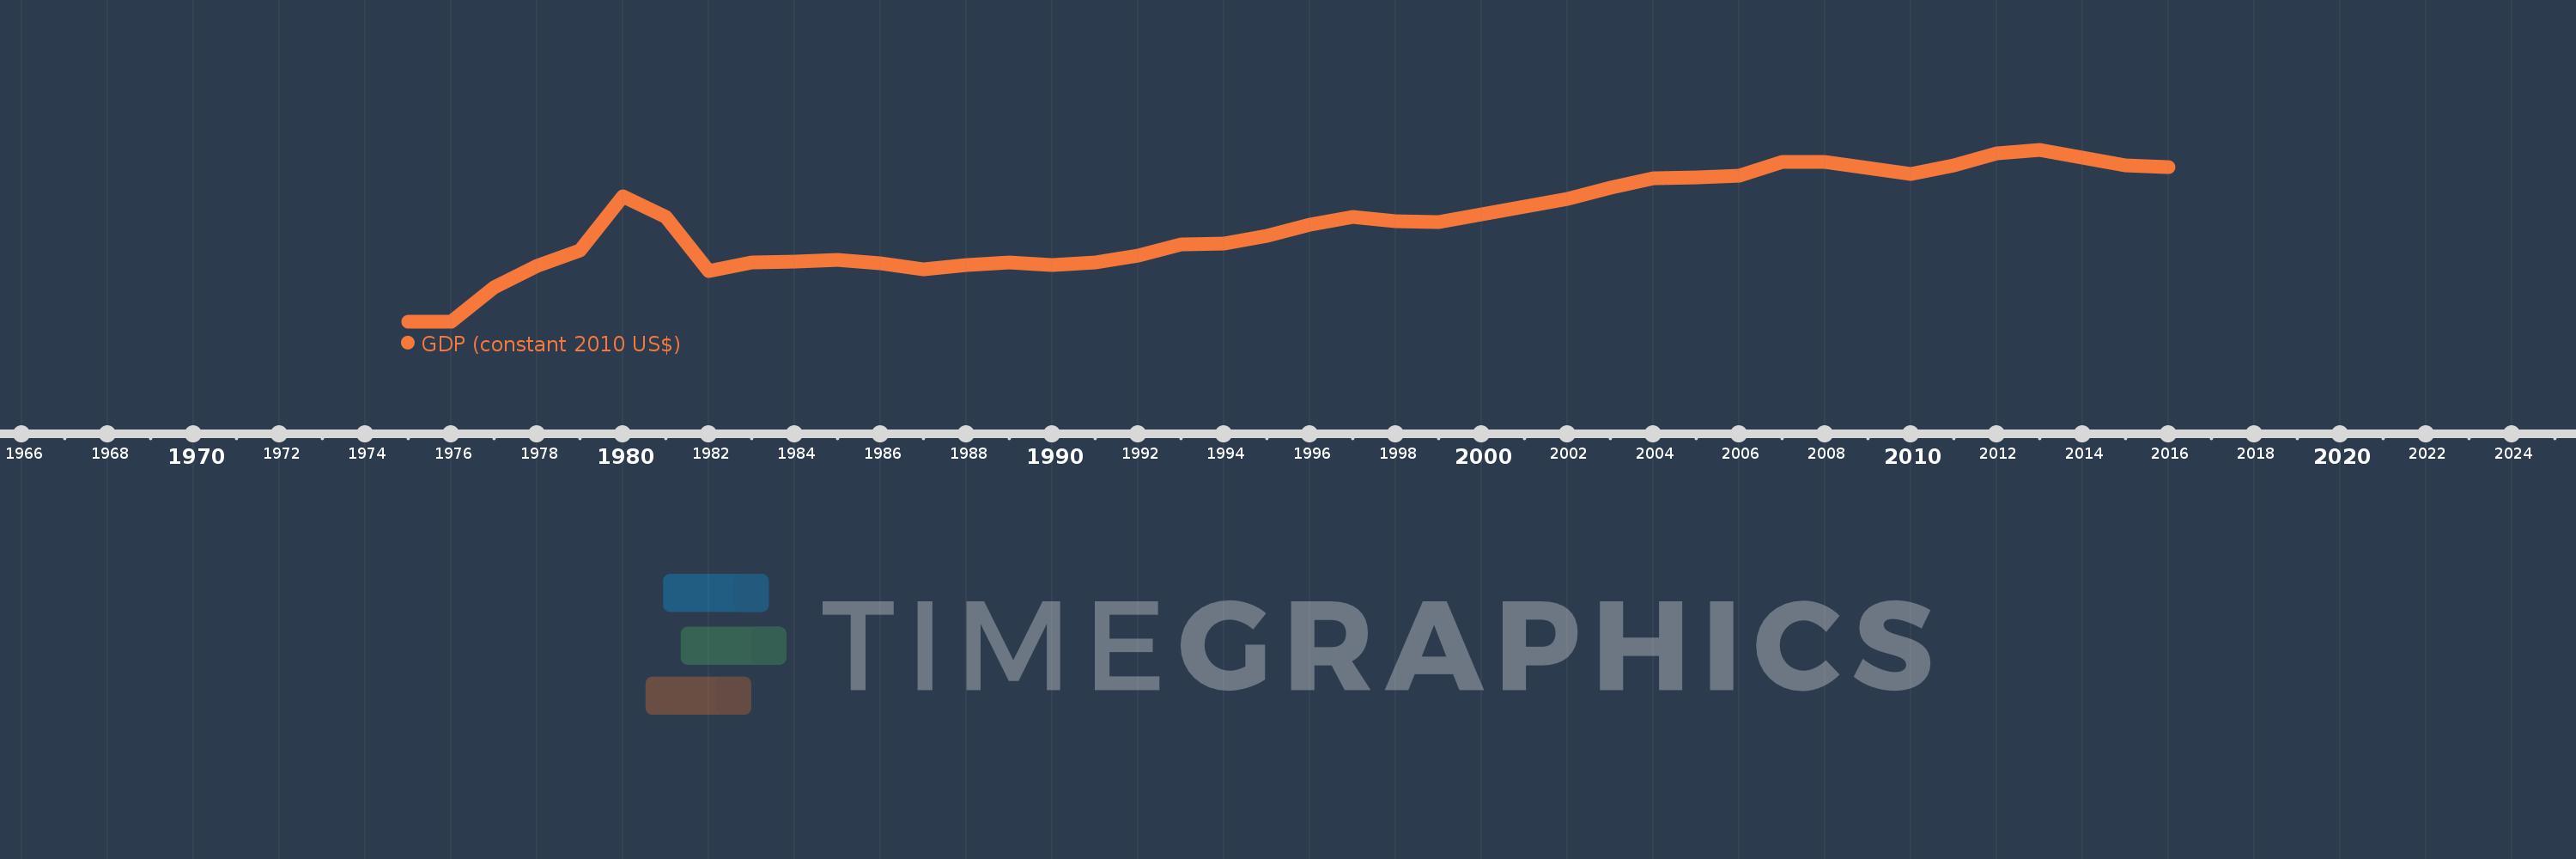
GDP (constant 2010 US$)
2016,2015,2014,2013,2012,2011,2010,2009,2008,2007,2006,2005,2004,2003,2002,2001,2000,1999,1998,1997,1996,1995,1994,1993,1992,1991,1990,1989,1988,1987,1986,1985,1984,1983,1982,1981,1980,1979,1978,1977,1976,1975
This statistics in other country:
AfghanistanAlbaniaAlgeriaAndorraAngolaAntigua and BarbudaArab WorldArgentinaArmeniaArubaAustraliaAustriaAzerbaijanBahamas, TheBahrainBangladeshBarbadosBelarusBelgiumBelizeBeninBermudaBhutanBoliviaBosnia and HerzegovinaBotswanaBrazilBrunei DarussalamBulgariaBurkina FasoBurundiCabo VerdeCambodiaCameroonCanadaCaribbean small statesCentral African RepublicCentral Europe and the BalticsChadChileChinaColombiaComorosCongo, Dem. Rep.Congo, Rep.Costa RicaCote d'IvoireCroatiaCubaCyprusCzech RepublicDenmarkDjiboutiDominicaDominican RepublicEarly-demographic dividendEast Asia & PacificEast Asia & Pacific (excluding high income)East Asia & Pacific (IDA & IBRD countries)EcuadorEgypt, Arab Rep.El SalvadorEquatorial GuineaEritreaEstoniaEthiopiaEuro areaEurope & Central AsiaEurope & Central Asia (excluding high income)Europe & Central Asia (IDA & IBRD countries)European UnionFaroe IslandsFijiFinlandFragile and conflict affected situationsFranceGabonGambia, TheGeorgiaGermanyGhanaGreeceGreenlandGrenadaGuatemalaGuineaGuinea-BissauGuyanaHaitiHeavily indebted poor countries (HIPC)High incomeHondurasHong Kong SAR, ChinaHungaryIBRD onlyIcelandIDA & IBRD totalIDA blendIDA onlyIDA totalIndiaIndonesiaIran, Islamic Rep.IraqIrelandIsle of ManIsraelItalyJamaicaJapanJordanKazakhstanKenyaKiribatiKorea, Rep.KosovoKuwaitKyrgyz RepublicLao PDRLate-demographic dividendLatin America & Caribbean Latin America & Caribbean (excluding high income)Latin America & the Caribbean (IDA & IBRD countries)LatviaLeast developed countries: UN classificationLebanonLesothoLiberiaLibyaLiechtensteinLithuaniaLow & middle incomeLow incomeLower middle incomeLuxembourgMacao SAR, ChinaMacedonia, FYRMadagascarMalawiMalaysiaMaldivesMaliMaltaMarshall IslandsMauritaniaMauritiusMexicoMicronesia, Fed. Sts.Middle East & North AfricaMiddle East & North Africa (excluding high income)Middle East & North Africa (IDA & IBRD countries)Middle incomeMoldovaMonacoMongoliaMontenegroMoroccoMozambiqueMyanmarNamibiaNauruNepalNetherlandsNew ZealandNicaraguaNigerNigeriaNorth AmericaNorwayOECD membersOmanOther small statesPacific island small statesPakistanPalauPanamaPapua New GuineaParaguayPeruPhilippinesPolandPortugalPost-demographic dividendPre-demographic dividendPuerto RicoQatarRomaniaRussian FederationRwandaSamoaSao Tome and PrincipeSaudi ArabiaSenegalSerbiaSeychellesSierra LeoneSingaporeSlovak RepublicSloveniaSmall statesSolomon IslandsSouth AfricaSouth AsiaSouth Asia (IDA & IBRD)South SudanSpainSri LankaSt. Kitts and NevisSt. LuciaSt. Vincent and the GrenadinesSub-Saharan Africa Sub-Saharan Africa (excluding high income)Sub-Saharan Africa (IDA & IBRD countries)SudanSurinameSwazilandSwedenSwitzerlandTajikistanTanzaniaThailandTimor-LesteTogoTongaTrinidad and TobagoTunisiaTurkeyTurkmenistanTuvaluUgandaUkraineUnited Arab EmiratesUnited KingdomUnited StatesUpper middle incomeUruguayUzbekistanVanuatuVenezuela, RBVietnamWest Bank and GazaWorldYemen, Rep.ZambiaZimbabwe Timeline:
This timeline shows a graph from 1975 to 2016 of Brunei Darussalam. No data until 1974. Number of actual observations by date: 42.
Source name:
World Development Indicators
Source organization:
World Bank national accounts data, and OECD National Accounts data files.
Categories, topics:
Economy & Growth
Last updated:
apr 23, 2017
Indicators value changes by year
Minimum:
7.076 bln
jan 1, 1975
Maximum:
14.351 bln
jan 1, 2013
At the date of observation
Value
Absolute change
Change from previous value
jan 1, 1975
7.076 bln
+7.076 bln
0.0%
jan 1, 1976
7.101 bln
+25.154 mln
0.36%
jan 1, 1977
8.533 bln
+1.431 bln
20.16%
jan 1, 1978
9.464 bln
+931.496 mln
10.92%
jan 1, 1979
10.106 bln
+641.282 mln
6.78%
jan 1, 1980
12.386 bln
+2.28 bln
22.56%
jan 1, 1981
11.519 bln
-866.583 mln
-7.0%
jan 1, 1982
9.235 bln
-2.284 bln
-19.83%
jan 1, 1983
9.601 bln
+365.404 mln
3.96%
jan 1, 1984
9.649 bln
+48.144 mln
0.5%
jan 1, 1985
9.707 bln
+57.88 mln
0.6%
jan 1, 1986
9.562 bln
-144.701 mln
-1.49%
jan 1, 1987
9.302 bln
-259.65 mln
-2.72%
jan 1, 1988
9.489 bln
+186.894 mln
2.01%
jan 1, 1989
9.593 bln
+104.131 mln
1.1%
jan 1, 1990
9.49 bln
-103.049 mln
-1.07%
jan 1, 1991
9.594 bln
+103.388 mln
1.09%
jan 1, 1992
9.895 bln
+301.809 mln
3.15%
jan 1, 1993
10.366 bln
+470.881 mln
4.76%
jan 1, 1994
10.398 bln
+31.573 mln
0.3%
jan 1, 1995
10.725 bln
+327.054 mln
3.15%
jan 1, 1996
11.205 bln
+480.338 mln
4.48%
jan 1, 1997
11.528 bln
+322.523 mln
2.88%
jan 1, 1998
11.358 bln
-169.594 mln
-1.47%
jan 1, 1999
11.295 bln
-63.437 mln
-0.56%
jan 1, 2000
11.639 bln
+344.734 mln
3.05%
jan 1, 2001
11.971 bln
+331.658 mln
2.85%
jan 1, 2002
12.3 bln
+328.493 mln
2.74%
jan 1, 2003
12.776 bln
+476.254 mln
3.87%
jan 1, 2004
13.147 bln
+371.006 mln
2.9%
jan 1, 2005
13.213 bln
+66.302 mln
0.5%
jan 1, 2006
13.264 bln
+51.202 mln
0.39%
jan 1, 2007
13.848 bln
+583.332 mln
4.4%
jan 1, 2008
13.869 bln
+21.406 mln
0.15%
jan 1, 2009
13.6 bln
-269.022 mln
-1.94%
jan 1, 2010
13.36 bln
-239.979 mln
-1.76%
jan 1, 2011
13.707 bln
+347.226 mln
2.6%
jan 1, 2012
14.221 bln
+513.385 mln
3.75%
jan 1, 2013
14.351 bln
+129.813 mln
0.91%
jan 1, 2014
14.045 bln
-305.097 mln
-2.13%
jan 1, 2015
13.715 bln
-330.033 mln
-2.35%
jan 1, 2016
13.638 bln
-77.741 mln
-0.57%
Ranking of countries by current statistics by years


Comments: