29
/
en
AIzaSyAYiBZKx7MnpbEhh9jyipgxe19OcubqV5w
April 1, 2024
55521
Pre-demographic dividend
PRE
false
2
1
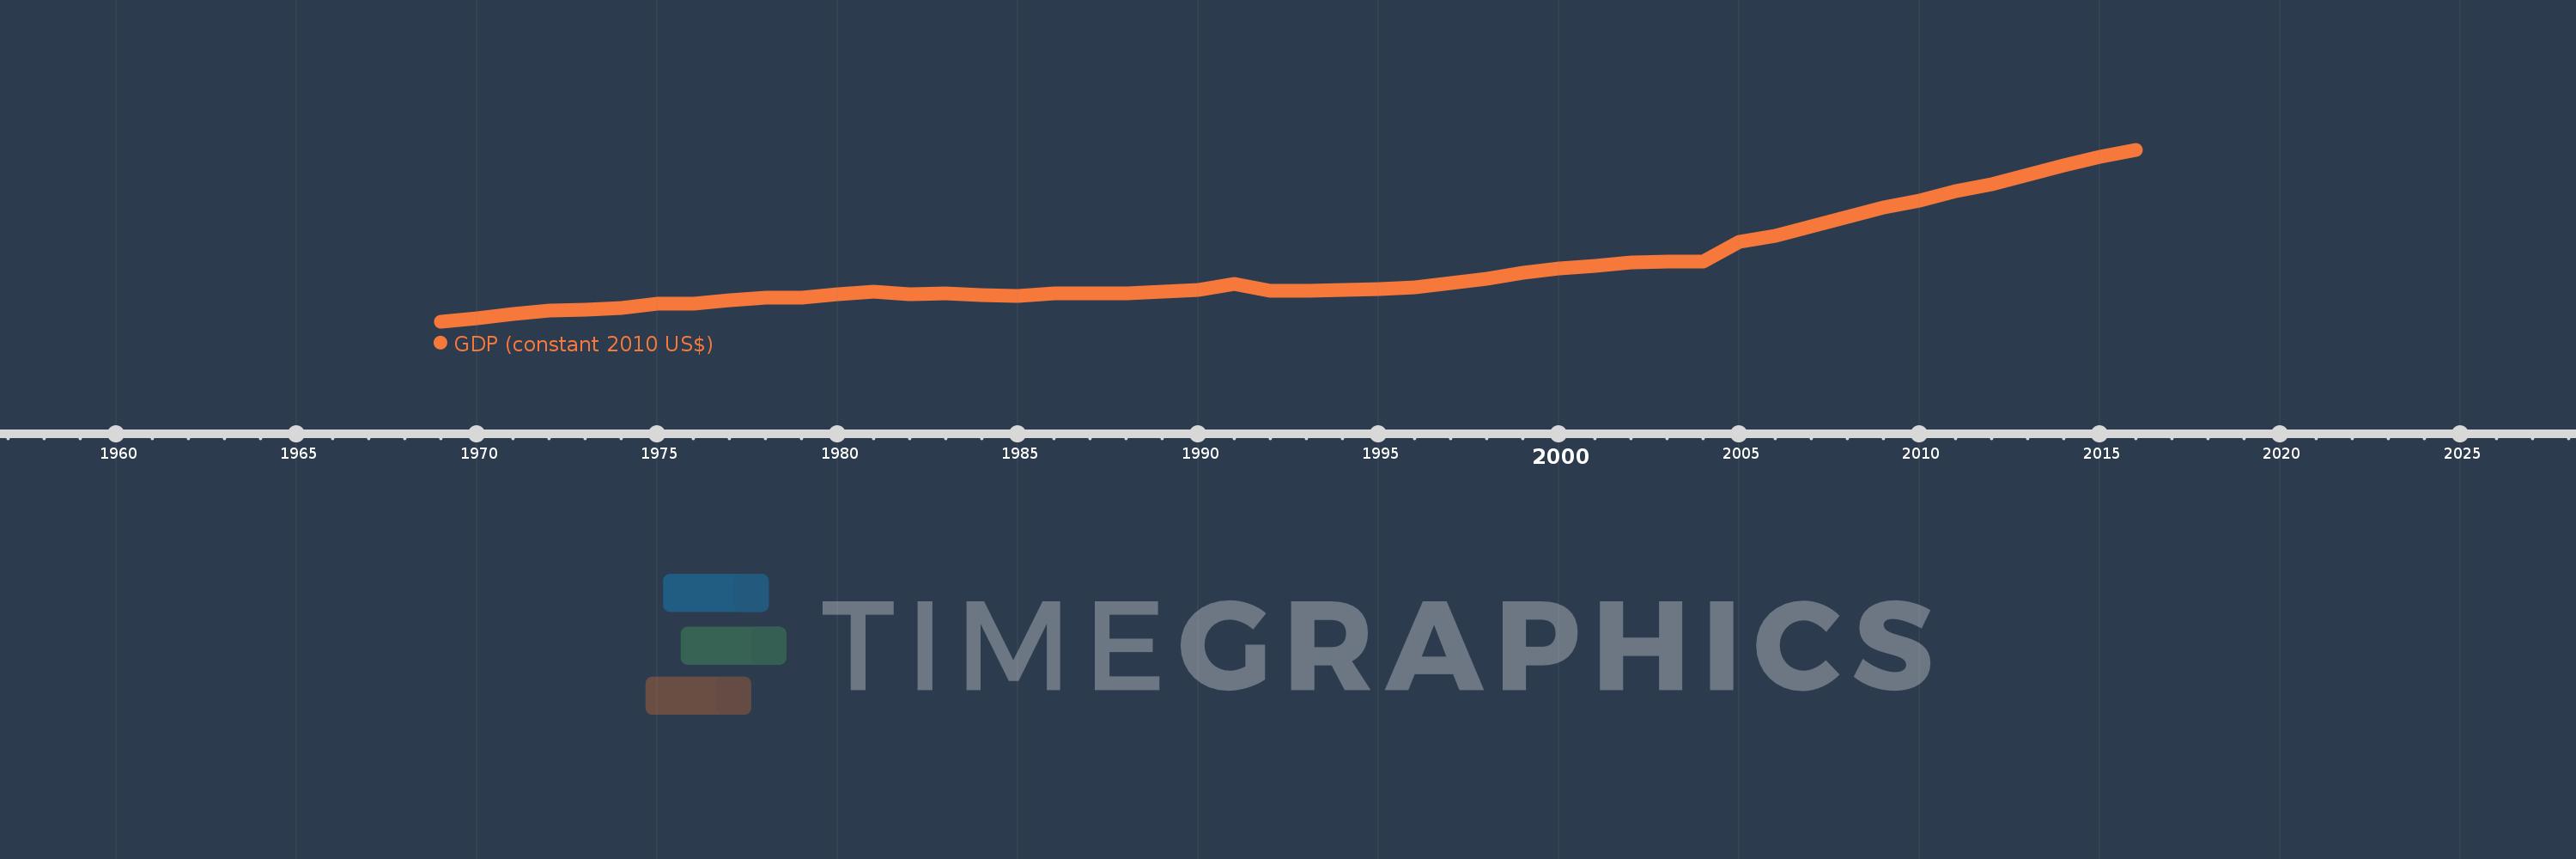
GDP (constant 2010 US$)
2016,2015,2014,2013,2012,2011,2010,2009,2008,2007,2006,2005,2004,2003,2002,2001,2000,1999,1998,1997,1996,1995,1994,1993,1992,1991,1990,1989,1988,1987,1986,1985,1984,1983,1982,1981,1980,1979,1978,1977,1976,1975,1974,1973,1972,1971,1970,1969
This statistics in other country:
AfghanistanAlbaniaAlgeriaAndorraAngolaAntigua and BarbudaArab WorldArgentinaArmeniaArubaAustraliaAustriaAzerbaijanBahamas, TheBahrainBangladeshBarbadosBelarusBelgiumBelizeBeninBermudaBhutanBoliviaBosnia and HerzegovinaBotswanaBrazilBrunei DarussalamBulgariaBurkina FasoBurundiCabo VerdeCambodiaCameroonCanadaCaribbean small statesCentral African RepublicCentral Europe and the BalticsChadChileChinaColombiaComorosCongo, Dem. Rep.Congo, Rep.Costa RicaCote d'IvoireCroatiaCubaCyprusCzech RepublicDenmarkDjiboutiDominicaDominican RepublicEarly-demographic dividendEast Asia & PacificEast Asia & Pacific (excluding high income)East Asia & Pacific (IDA & IBRD countries)EcuadorEgypt, Arab Rep.El SalvadorEquatorial GuineaEritreaEstoniaEthiopiaEuro areaEurope & Central AsiaEurope & Central Asia (excluding high income)Europe & Central Asia (IDA & IBRD countries)European UnionFaroe IslandsFijiFinlandFragile and conflict affected situationsFranceGabonGambia, TheGeorgiaGermanyGhanaGreeceGreenlandGrenadaGuatemalaGuineaGuinea-BissauGuyanaHaitiHeavily indebted poor countries (HIPC)High incomeHondurasHong Kong SAR, ChinaHungaryIBRD onlyIcelandIDA & IBRD totalIDA blendIDA onlyIDA totalIndiaIndonesiaIran, Islamic Rep.IraqIrelandIsle of ManIsraelItalyJamaicaJapanJordanKazakhstanKenyaKiribatiKorea, Rep.KosovoKuwaitKyrgyz RepublicLao PDRLate-demographic dividendLatin America & Caribbean Latin America & Caribbean (excluding high income)Latin America & the Caribbean (IDA & IBRD countries)LatviaLeast developed countries: UN classificationLebanonLesothoLiberiaLibyaLiechtensteinLithuaniaLow & middle incomeLow incomeLower middle incomeLuxembourgMacao SAR, ChinaMacedonia, FYRMadagascarMalawiMalaysiaMaldivesMaliMaltaMarshall IslandsMauritaniaMauritiusMexicoMicronesia, Fed. Sts.Middle East & North AfricaMiddle East & North Africa (excluding high income)Middle East & North Africa (IDA & IBRD countries)Middle incomeMoldovaMonacoMongoliaMontenegroMoroccoMozambiqueMyanmarNamibiaNauruNepalNetherlandsNew ZealandNicaraguaNigerNigeriaNorth AmericaNorwayOECD membersOmanOther small statesPacific island small statesPakistanPalauPanamaPapua New GuineaParaguayPeruPhilippinesPolandPortugalPost-demographic dividendPre-demographic dividendPuerto RicoQatarRomaniaRussian FederationRwandaSamoaSao Tome and PrincipeSaudi ArabiaSenegalSerbiaSeychellesSierra LeoneSingaporeSlovak RepublicSloveniaSmall statesSolomon IslandsSouth AfricaSouth AsiaSouth Asia (IDA & IBRD)South SudanSpainSri LankaSt. Kitts and NevisSt. LuciaSt. Vincent and the GrenadinesSub-Saharan Africa Sub-Saharan Africa (excluding high income)Sub-Saharan Africa (IDA & IBRD countries)SudanSurinameSwazilandSwedenSwitzerlandTajikistanTanzaniaThailandTimor-LesteTogoTongaTrinidad and TobagoTunisiaTurkeyTurkmenistanTuvaluUgandaUkraineUnited Arab EmiratesUnited KingdomUnited StatesUpper middle incomeUruguayUzbekistanVanuatuVenezuela, RBVietnamWest Bank and GazaWorldYemen, Rep.ZambiaZimbabwe Timeline:
This timeline shows a graph from 1969 to 2016 of Pre-demographic dividend. No data until 1968. Number of actual observations by date: 48.
Source name:
World Development Indicators
Source organization:
World Bank national accounts data, and OECD National Accounts data files.
Categories, topics:
Economy & Growth
Last updated:
apr 23, 2017
Indicators value changes by year
Minimum:
186.947 bln
jan 1, 1969
Maximum:
1.264 trl
jan 1, 2016
At the date of observation
Value
Absolute change
Change from previous value
jan 1, 1969
186.947 bln
+186.947 bln
0.0%
jan 1, 1970
209.174 bln
+22.227 bln
11.89%
jan 1, 1971
235.486 bln
+26.312 bln
12.58%
jan 1, 1972
257.816 bln
+22.33 bln
9.48%
jan 1, 1973
266.128 bln
+8.312 bln
3.22%
jan 1, 1974
276.989 bln
+10.861 bln
4.08%
jan 1, 1975
301.891 bln
+24.902 bln
8.99%
jan 1, 1976
301.095 bln
-795.452 mln
-0.26%
jan 1, 1977
323.702 bln
+22.607 bln
7.51%
jan 1, 1978
339.008 bln
+15.306 bln
4.73%
jan 1, 1979
338.689 bln
-318.756 mln
-0.09%
jan 1, 1980
359.831 bln
+21.142 bln
6.24%
jan 1, 1981
377.474 bln
+17.644 bln
4.9%
jan 1, 1982
361.983 bln
-15.491 bln
-4.1%
jan 1, 1983
366.347 bln
+4.364 bln
1.21%
jan 1, 1984
353.094 bln
-13.253 bln
-3.62%
jan 1, 1985
351.75 bln
-1.344 bln
-0.38%
jan 1, 1986
368.252 bln
+16.502 bln
4.69%
jan 1, 1987
365.104 bln
-3.148 bln
-0.85%
jan 1, 1988
363.91 bln
-1.194 bln
-0.33%
jan 1, 1989
376.903 bln
+12.993 bln
3.57%
jan 1, 1990
387.041 bln
+10.138 bln
2.69%
jan 1, 1991
426.957 bln
+39.917 bln
10.31%
jan 1, 1992
379.991 bln
-46.966 bln
-11.0%
jan 1, 1993
384.986 bln
+4.995 bln
1.31%
jan 1, 1994
390.007 bln
+5.021 bln
1.3%
jan 1, 1995
394.943 bln
+4.935 bln
1.27%
jan 1, 1996
406.426 bln
+11.484 bln
2.91%
jan 1, 1997
431.694 bln
+25.268 bln
6.22%
jan 1, 1998
458.542 bln
+26.848 bln
6.22%
jan 1, 1999
496.067 bln
+37.525 bln
8.18%
jan 1, 2000
520.481 bln
+24.414 bln
4.92%
jan 1, 2001
536.76 bln
+16.279 bln
3.13%
jan 1, 2002
560.332 bln
+23.573 bln
4.39%
jan 1, 2003
565.868 bln
+5.535 bln
0.99%
jan 1, 2004
566.706 bln
+838.033 mln
0.15%
jan 1, 2005
687.404 bln
+120.699 bln
21.3%
jan 1, 2006
726.827 bln
+39.422 bln
5.73%
jan 1, 2007
787.758 bln
+60.931 bln
8.38%
jan 1, 2008
844.6 bln
+56.842 bln
7.22%
jan 1, 2009
902.656 bln
+58.056 bln
6.87%
jan 1, 2010
947.255 bln
+44.599 bln
4.94%
jan 1, 2011
1.005 trl
+57.855 bln
6.11%
jan 1, 2012
1.051 trl
+45.394 bln
4.52%
jan 1, 2013
1.107 trl
+56.819 bln
5.41%
jan 1, 2014
1.168 trl
+61.137 bln
5.52%
jan 1, 2015
1.223 trl
+55.014 bln
4.71%
jan 1, 2016
1.264 trl
+40.502 bln
3.31%
Ranking of countries by current statistics by years


Comments: