29
/
en
AIzaSyAYiBZKx7MnpbEhh9jyipgxe19OcubqV5w
April 1, 2024
278759
Uzbekistan
UZB
true
2
1
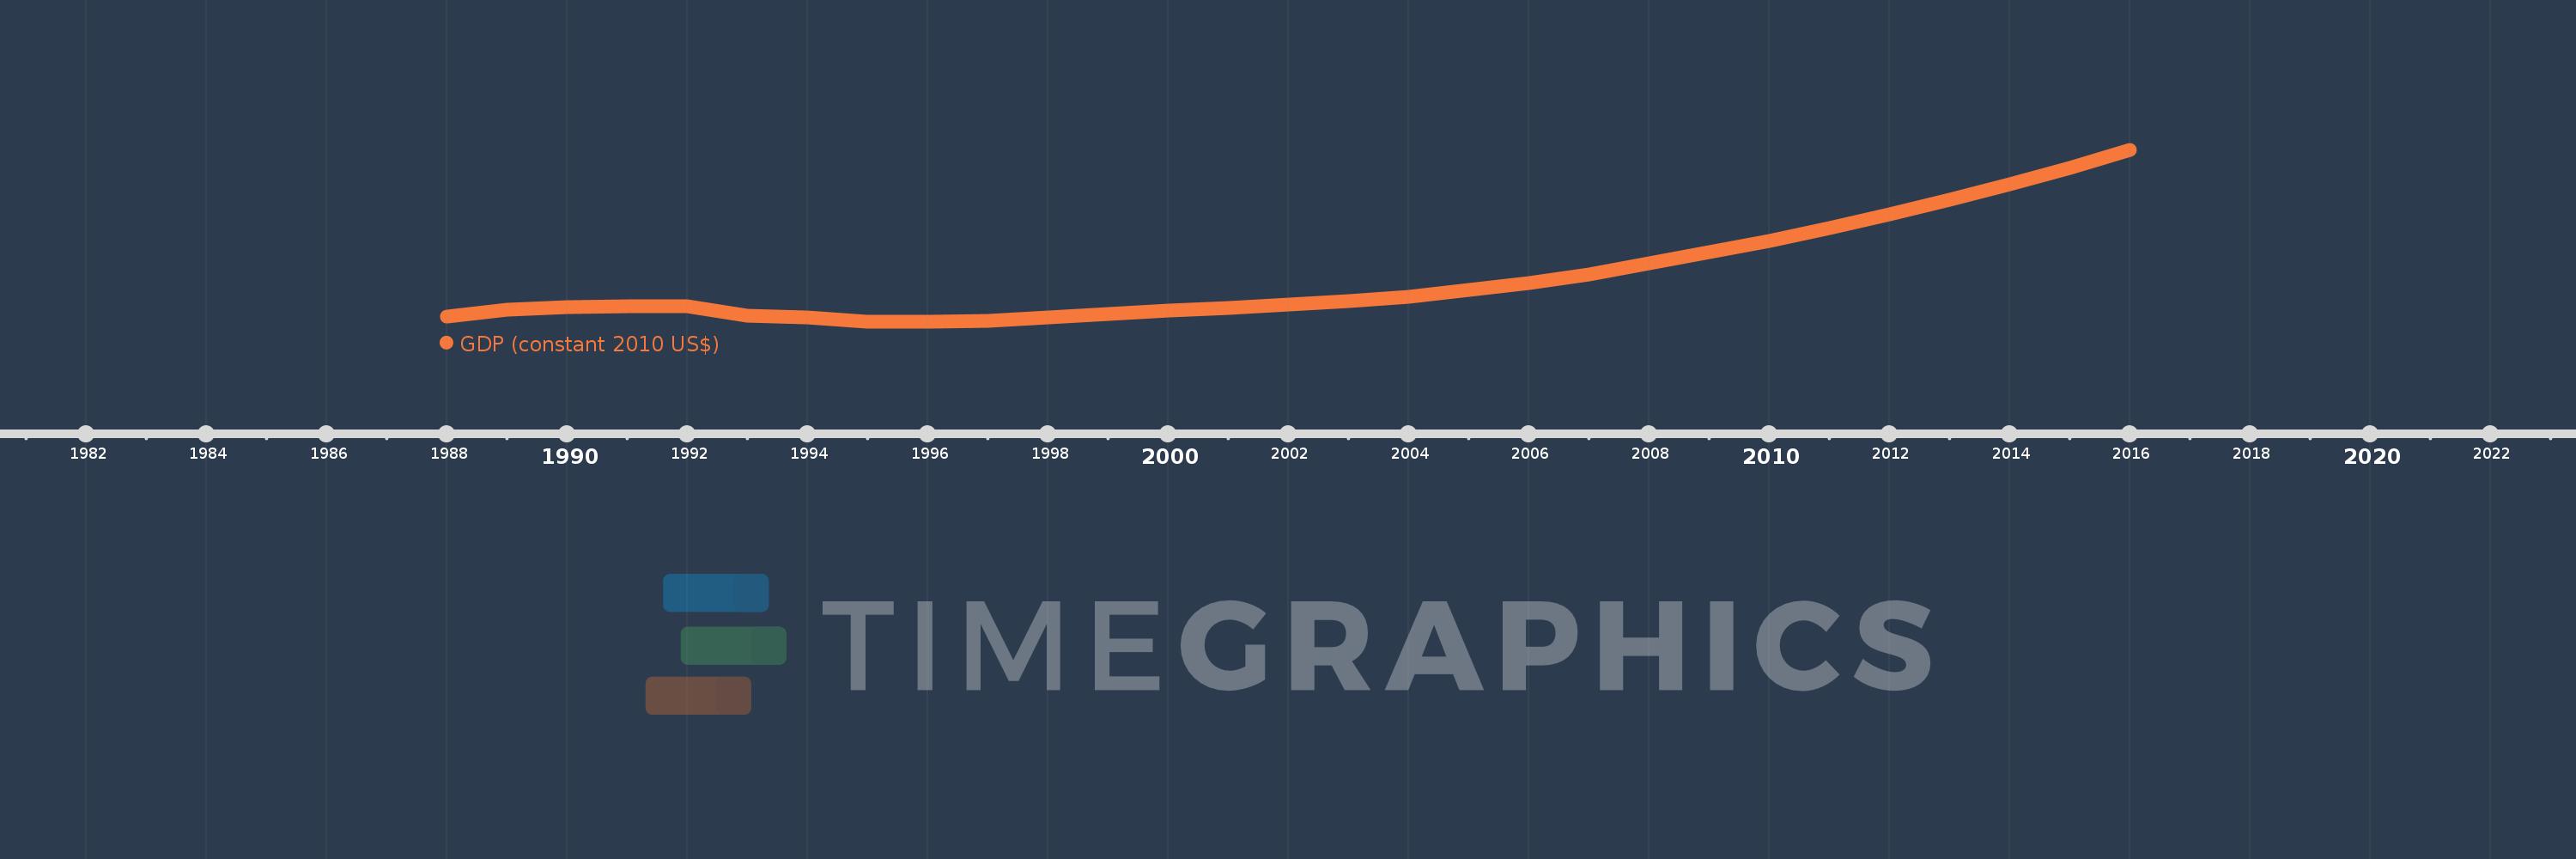
GDP (constant 2010 US$)
2016,2015,2014,2013,2012,2011,2010,2009,2008,2007,2006,2005,2004,2003,2002,2001,2000,1999,1998,1997,1996,1995,1994,1993,1992,1991,1990,1989,1988
This statistics in other country:
AfghanistanAlbaniaAlgeriaAndorraAngolaAntigua and BarbudaArab WorldArgentinaArmeniaArubaAustraliaAustriaAzerbaijanBahamas, TheBahrainBangladeshBarbadosBelarusBelgiumBelizeBeninBermudaBhutanBoliviaBosnia and HerzegovinaBotswanaBrazilBrunei DarussalamBulgariaBurkina FasoBurundiCabo VerdeCambodiaCameroonCanadaCaribbean small statesCentral African RepublicCentral Europe and the BalticsChadChileChinaColombiaComorosCongo, Dem. Rep.Congo, Rep.Costa RicaCote d'IvoireCroatiaCubaCyprusCzech RepublicDenmarkDjiboutiDominicaDominican RepublicEarly-demographic dividendEast Asia & PacificEast Asia & Pacific (excluding high income)East Asia & Pacific (IDA & IBRD countries)EcuadorEgypt, Arab Rep.El SalvadorEquatorial GuineaEritreaEstoniaEthiopiaEuro areaEurope & Central AsiaEurope & Central Asia (excluding high income)Europe & Central Asia (IDA & IBRD countries)European UnionFaroe IslandsFijiFinlandFragile and conflict affected situationsFranceGabonGambia, TheGeorgiaGermanyGhanaGreeceGreenlandGrenadaGuatemalaGuineaGuinea-BissauGuyanaHaitiHeavily indebted poor countries (HIPC)High incomeHondurasHong Kong SAR, ChinaHungaryIBRD onlyIcelandIDA & IBRD totalIDA blendIDA onlyIDA totalIndiaIndonesiaIran, Islamic Rep.IraqIrelandIsle of ManIsraelItalyJamaicaJapanJordanKazakhstanKenyaKiribatiKorea, Rep.KosovoKuwaitKyrgyz RepublicLao PDRLate-demographic dividendLatin America & Caribbean Latin America & Caribbean (excluding high income)Latin America & the Caribbean (IDA & IBRD countries)LatviaLeast developed countries: UN classificationLebanonLesothoLiberiaLibyaLiechtensteinLithuaniaLow & middle incomeLow incomeLower middle incomeLuxembourgMacao SAR, ChinaMacedonia, FYRMadagascarMalawiMalaysiaMaldivesMaliMaltaMarshall IslandsMauritaniaMauritiusMexicoMicronesia, Fed. Sts.Middle East & North AfricaMiddle East & North Africa (excluding high income)Middle East & North Africa (IDA & IBRD countries)Middle incomeMoldovaMonacoMongoliaMontenegroMoroccoMozambiqueMyanmarNamibiaNauruNepalNetherlandsNew ZealandNicaraguaNigerNigeriaNorth AmericaNorwayOECD membersOmanOther small statesPacific island small statesPakistanPalauPanamaPapua New GuineaParaguayPeruPhilippinesPolandPortugalPost-demographic dividendPre-demographic dividendPuerto RicoQatarRomaniaRussian FederationRwandaSamoaSao Tome and PrincipeSaudi ArabiaSenegalSerbiaSeychellesSierra LeoneSingaporeSlovak RepublicSloveniaSmall statesSolomon IslandsSouth AfricaSouth AsiaSouth Asia (IDA & IBRD)South SudanSpainSri LankaSt. Kitts and NevisSt. LuciaSt. Vincent and the GrenadinesSub-Saharan Africa Sub-Saharan Africa (excluding high income)Sub-Saharan Africa (IDA & IBRD countries)SudanSurinameSwazilandSwedenSwitzerlandTajikistanTanzaniaThailandTimor-LesteTogoTongaTrinidad and TobagoTunisiaTurkeyTurkmenistanTuvaluUgandaUkraineUnited Arab EmiratesUnited KingdomUnited StatesUpper middle incomeUruguayUzbekistanVanuatuVenezuela, RBVietnamWest Bank and GazaWorldYemen, Rep.ZambiaZimbabwe Timeline:
This timeline shows a graph from 1988 to 2016 of Uzbekistan. No data until 1987. Number of actual observations by date: 29.
Source name:
World Development Indicators
Source organization:
World Bank national accounts data, and OECD National Accounts data files.
Categories, topics:
Economy & Growth
Last updated:
apr 23, 2017
Indicators value changes by year
Minimum:
16.593 bln
jan 1, 1996
Maximum:
58.114 bln
jan 1, 2016
At the date of observation
Value
Absolute change
Change from previous value
jan 1, 1988
17.897 bln
+17.897 bln
0.0%
jan 1, 1989
19.532 bln
+1.636 bln
9.14%
jan 1, 1990
20.136 bln
+603.806 mln
3.09%
jan 1, 1991
20.458 bln
+322.181 mln
1.6%
jan 1, 1992
20.358 bln
-100.656 mln
-0.49%
jan 1, 1993
18.078 bln
-2.28 bln
-11.2%
jan 1, 1994
17.662 bln
-415.788 mln
-2.3%
jan 1, 1995
16.744 bln
-918.422 mln
-5.2%
jan 1, 1996
16.593 bln
-150.692 mln
-0.9%
jan 1, 1997
16.875 bln
+282.078 mln
1.7%
jan 1, 1998
17.752 bln
+877.496 mln
5.2%
jan 1, 1999
18.516 bln
+763.354 mln
4.3%
jan 1, 2000
19.312 bln
+796.178 mln
4.3%
jan 1, 2001
20.046 bln
+733.854 mln
3.8%
jan 1, 2002
20.888 bln
+841.924 mln
4.2%
jan 1, 2003
21.723 bln
+835.509 mln
4.0%
jan 1, 2004
22.636 bln
+912.376 mln
4.2%
jan 1, 2005
24.379 bln
+1.743 bln
7.7%
jan 1, 2006
26.085 bln
+1.706 bln
7.0%
jan 1, 2007
27.989 bln
+1.904 bln
7.3%
jan 1, 2008
30.766 bln
+2.777 bln
9.92%
jan 1, 2009
33.535 bln
+2.769 bln
9.0%
jan 1, 2010
36.251 bln
+2.716 bln
8.1%
jan 1, 2011
39.333 bln
+3.081 bln
8.5%
jan 1, 2012
42.597 bln
+3.265 bln
8.3%
jan 1, 2013
46.09 bln
+3.493 bln
8.2%
jan 1, 2014
49.778 bln
+3.687 bln
8.0%
jan 1, 2015
53.81 bln
+4.032 bln
8.1%
jan 1, 2016
58.114 bln
+4.305 bln
8.0%
Ranking of countries by current statistics by years


Comments: