29
/
en
AIzaSyAYiBZKx7MnpbEhh9jyipgxe19OcubqV5w
April 1, 2024
154594
India
IND
true
2
1
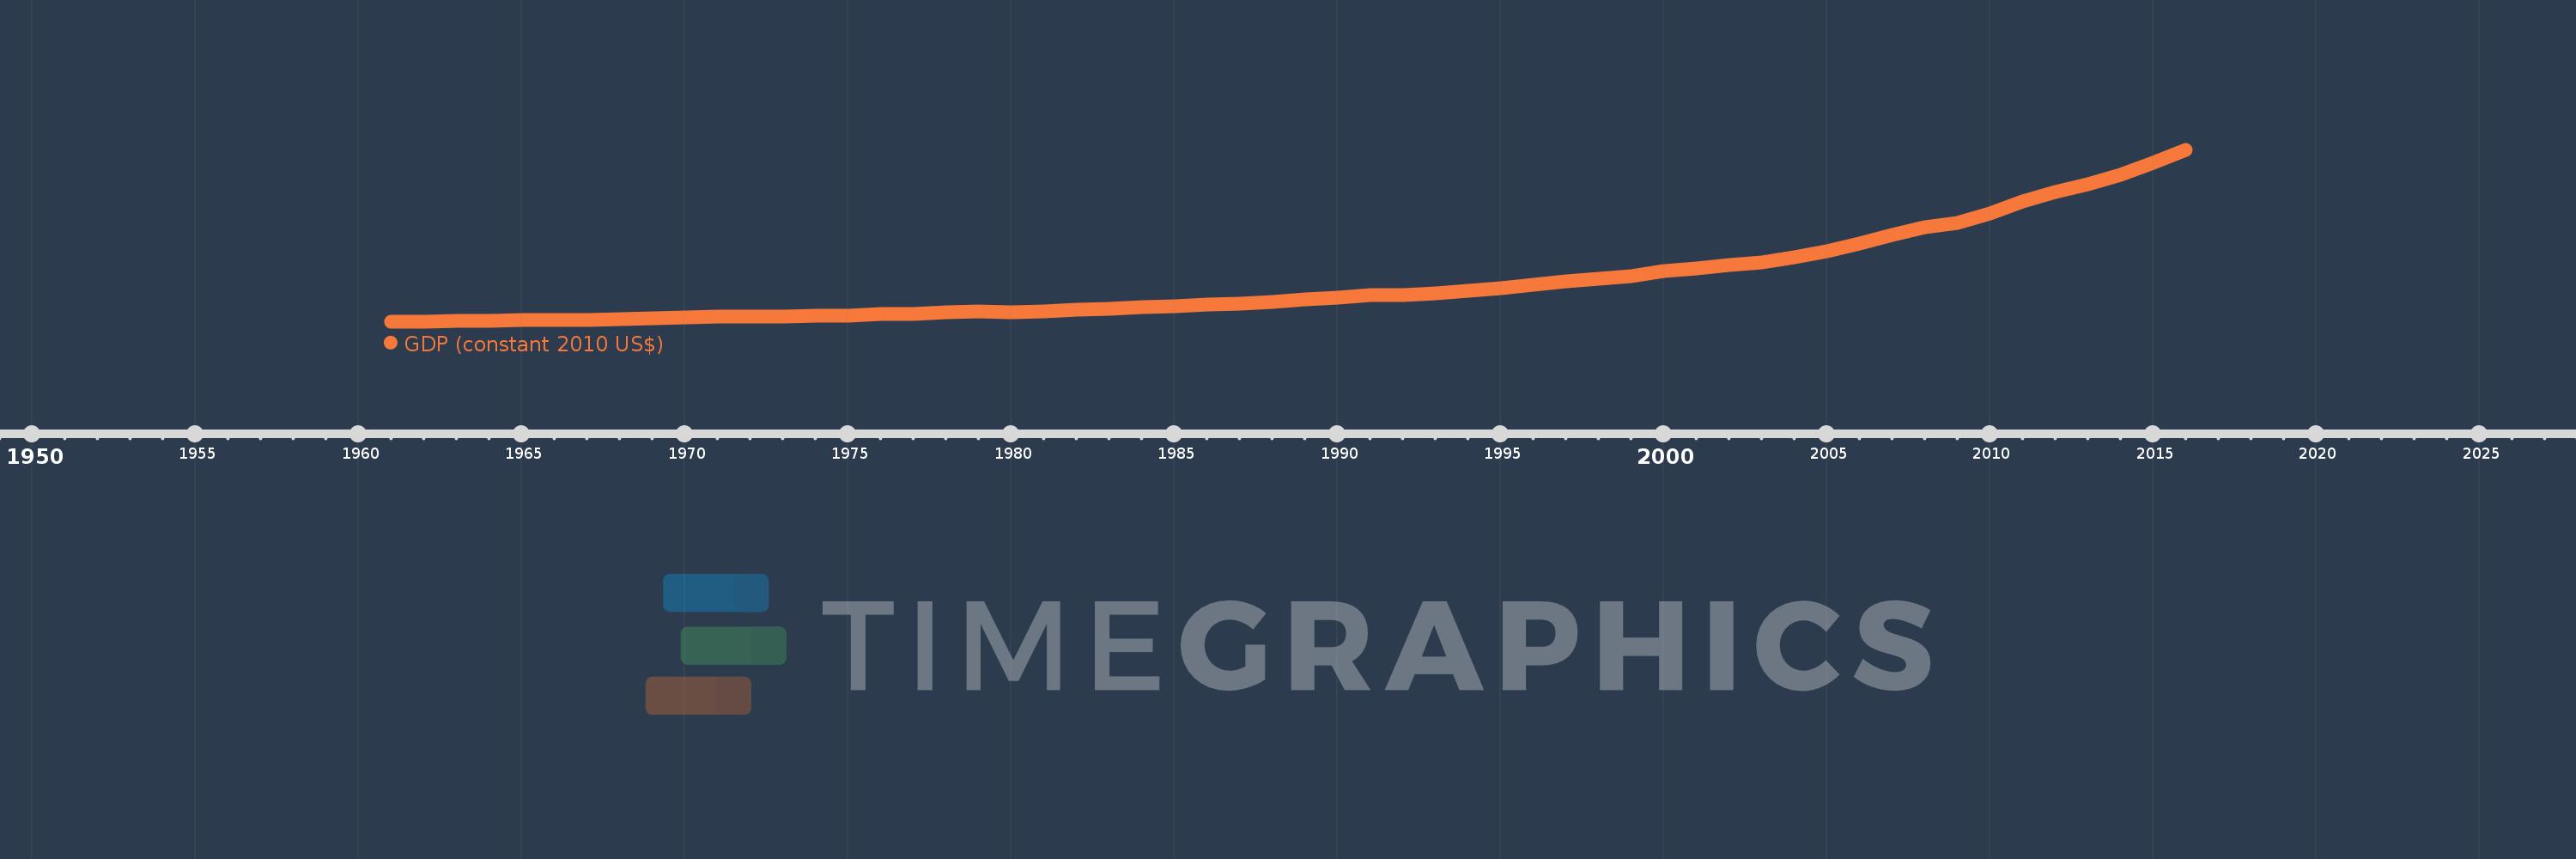
GDP (constant 2010 US$)
2016,2015,2014,2013,2012,2011,2010,2009,2008,2007,2006,2005,2004,2003,2002,2001,2000,1999,1998,1997,1996,1995,1994,1993,1992,1991,1990,1989,1988,1987,1986,1985,1984,1983,1982,1981,1980,1979,1978,1977,1976,1975,1974,1973,1972,1971,1970,1969,1968,1967,1966,1965,1964,1963,1962,1961
This statistics in other country:
AfghanistanAlbaniaAlgeriaAndorraAngolaAntigua and BarbudaArab WorldArgentinaArmeniaArubaAustraliaAustriaAzerbaijanBahamas, TheBahrainBangladeshBarbadosBelarusBelgiumBelizeBeninBermudaBhutanBoliviaBosnia and HerzegovinaBotswanaBrazilBrunei DarussalamBulgariaBurkina FasoBurundiCabo VerdeCambodiaCameroonCanadaCaribbean small statesCentral African RepublicCentral Europe and the BalticsChadChileChinaColombiaComorosCongo, Dem. Rep.Congo, Rep.Costa RicaCote d'IvoireCroatiaCubaCyprusCzech RepublicDenmarkDjiboutiDominicaDominican RepublicEarly-demographic dividendEast Asia & PacificEast Asia & Pacific (excluding high income)East Asia & Pacific (IDA & IBRD countries)EcuadorEgypt, Arab Rep.El SalvadorEquatorial GuineaEritreaEstoniaEthiopiaEuro areaEurope & Central AsiaEurope & Central Asia (excluding high income)Europe & Central Asia (IDA & IBRD countries)European UnionFaroe IslandsFijiFinlandFragile and conflict affected situationsFranceGabonGambia, TheGeorgiaGermanyGhanaGreeceGreenlandGrenadaGuatemalaGuineaGuinea-BissauGuyanaHaitiHeavily indebted poor countries (HIPC)High incomeHondurasHong Kong SAR, ChinaHungaryIBRD onlyIcelandIDA & IBRD totalIDA blendIDA onlyIDA totalIndiaIndonesiaIran, Islamic Rep.IraqIrelandIsle of ManIsraelItalyJamaicaJapanJordanKazakhstanKenyaKiribatiKorea, Rep.KosovoKuwaitKyrgyz RepublicLao PDRLate-demographic dividendLatin America & Caribbean Latin America & Caribbean (excluding high income)Latin America & the Caribbean (IDA & IBRD countries)LatviaLeast developed countries: UN classificationLebanonLesothoLiberiaLibyaLiechtensteinLithuaniaLow & middle incomeLow incomeLower middle incomeLuxembourgMacao SAR, ChinaMacedonia, FYRMadagascarMalawiMalaysiaMaldivesMaliMaltaMarshall IslandsMauritaniaMauritiusMexicoMicronesia, Fed. Sts.Middle East & North AfricaMiddle East & North Africa (excluding high income)Middle East & North Africa (IDA & IBRD countries)Middle incomeMoldovaMonacoMongoliaMontenegroMoroccoMozambiqueMyanmarNamibiaNauruNepalNetherlandsNew ZealandNicaraguaNigerNigeriaNorth AmericaNorwayOECD membersOmanOther small statesPacific island small statesPakistanPalauPanamaPapua New GuineaParaguayPeruPhilippinesPolandPortugalPost-demographic dividendPre-demographic dividendPuerto RicoQatarRomaniaRussian FederationRwandaSamoaSao Tome and PrincipeSaudi ArabiaSenegalSerbiaSeychellesSierra LeoneSingaporeSlovak RepublicSloveniaSmall statesSolomon IslandsSouth AfricaSouth AsiaSouth Asia (IDA & IBRD)South SudanSpainSri LankaSt. Kitts and NevisSt. LuciaSt. Vincent and the GrenadinesSub-Saharan Africa Sub-Saharan Africa (excluding high income)Sub-Saharan Africa (IDA & IBRD countries)SudanSurinameSwazilandSwedenSwitzerlandTajikistanTanzaniaThailandTimor-LesteTogoTongaTrinidad and TobagoTunisiaTurkeyTurkmenistanTuvaluUgandaUkraineUnited Arab EmiratesUnited KingdomUnited StatesUpper middle incomeUruguayUzbekistanVanuatuVenezuela, RBVietnamWest Bank and GazaWorldYemen, Rep.ZambiaZimbabwe Timeline:
This timeline shows a graph from 1961 to 2016 of India. No data until 1960. Number of actual observations by date: 56.
Source name:
World Development Indicators
Source organization:
World Bank national accounts data, and OECD National Accounts data files.
Categories, topics:
Economy & Growth
Last updated:
apr 23, 2017
Indicators value changes by year
Minimum:
138.244 bln
jan 1, 1961
Maximum:
2.295 trl
jan 1, 2016
At the date of observation
Value
Absolute change
Change from previous value
jan 1, 1961
138.244 bln
+138.244 bln
0.0%
jan 1, 1962
143.391 bln
+5.146 bln
3.72%
jan 1, 1963
147.593 bln
+4.203 bln
2.93%
jan 1, 1964
156.441 bln
+8.847 bln
5.99%
jan 1, 1965
168.1 bln
+11.659 bln
7.45%
jan 1, 1966
163.669 bln
-4.431 bln
-2.64%
jan 1, 1967
163.579 bln
-90.556 mln
-0.06%
jan 1, 1968
176.381 bln
+12.802 bln
7.83%
jan 1, 1969
182.356 bln
+5.976 bln
3.39%
jan 1, 1970
194.282 bln
+11.926 bln
6.54%
jan 1, 1971
204.301 bln
+10.02 bln
5.16%
jan 1, 1972
207.658 bln
+3.357 bln
1.64%
jan 1, 1973
206.509 bln
-1.149 bln
-0.55%
jan 1, 1974
213.314 bln
+6.806 bln
3.3%
jan 1, 1975
215.843 bln
+2.528 bln
1.19%
jan 1, 1976
235.592 bln
+19.749 bln
9.15%
jan 1, 1977
239.51 bln
+3.918 bln
1.66%
jan 1, 1978
256.886 bln
+17.376 bln
7.25%
jan 1, 1979
271.561 bln
+14.675 bln
5.71%
jan 1, 1980
257.336 bln
-14.225 bln
-5.24%
jan 1, 1981
274.67 bln
+17.334 bln
6.74%
jan 1, 1982
291.167 bln
+16.497 bln
6.01%
jan 1, 1983
301.287 bln
+10.12 bln
3.48%
jan 1, 1984
323.248 bln
+21.961 bln
7.29%
jan 1, 1985
335.598 bln
+12.35 bln
3.82%
jan 1, 1986
353.232 bln
+17.633 bln
5.25%
jan 1, 1987
370.104 bln
+16.872 bln
4.78%
jan 1, 1988
384.78 bln
+14.676 bln
3.97%
jan 1, 1989
421.826 bln
+37.046 bln
9.63%
jan 1, 1990
446.913 bln
+25.087 bln
5.95%
jan 1, 1991
471.643 bln
+24.73 bln
5.53%
jan 1, 1992
476.627 bln
+4.984 bln
1.06%
jan 1, 1993
502.758 bln
+26.131 bln
5.48%
jan 1, 1994
526.643 bln
+23.885 bln
4.75%
jan 1, 1995
561.712 bln
+35.069 bln
6.66%
jan 1, 1996
604.258 bln
+42.547 bln
7.57%
jan 1, 1997
649.877 bln
+45.619 bln
7.55%
jan 1, 1998
676.196 bln
+26.319 bln
4.05%
jan 1, 1999
718.015 bln
+41.819 bln
6.18%
jan 1, 2000
781.528 bln
+63.514 bln
8.85%
jan 1, 2001
811.547 bln
+30.018 bln
3.84%
jan 1, 2002
850.696 bln
+39.149 bln
4.82%
jan 1, 2003
883.056 bln
+32.36 bln
3.8%
jan 1, 2004
952.467 bln
+69.412 bln
7.86%
jan 1, 2005
1.028 trl
+75.463 bln
7.92%
jan 1, 2006
1.123 trl
+95.442 bln
9.28%
jan 1, 2007
1.227 trl
+104.069 bln
9.26%
jan 1, 2008
1.333 trl
+105.661 bln
8.61%
jan 1, 2009
1.385 trl
+51.87 bln
3.89%
jan 1, 2010
1.502 trl
+117.443 bln
8.48%
jan 1, 2011
1.657 trl
+154.147 bln
10.26%
jan 1, 2012
1.767 trl
+109.969 bln
6.64%
jan 1, 2013
1.866 trl
+99.254 bln
5.62%
jan 1, 2014
1.99 trl
+123.866 bln
6.64%
jan 1, 2015
2.134 trl
+144.12 bln
7.24%
jan 1, 2016
2.295 trl
+161.385 bln
7.56%
Ranking of countries by current statistics by years


Comments: