29
/
en
AIzaSyAYiBZKx7MnpbEhh9jyipgxe19OcubqV5w
April 1, 2024
178852
Liberia
LBR
true
2
1
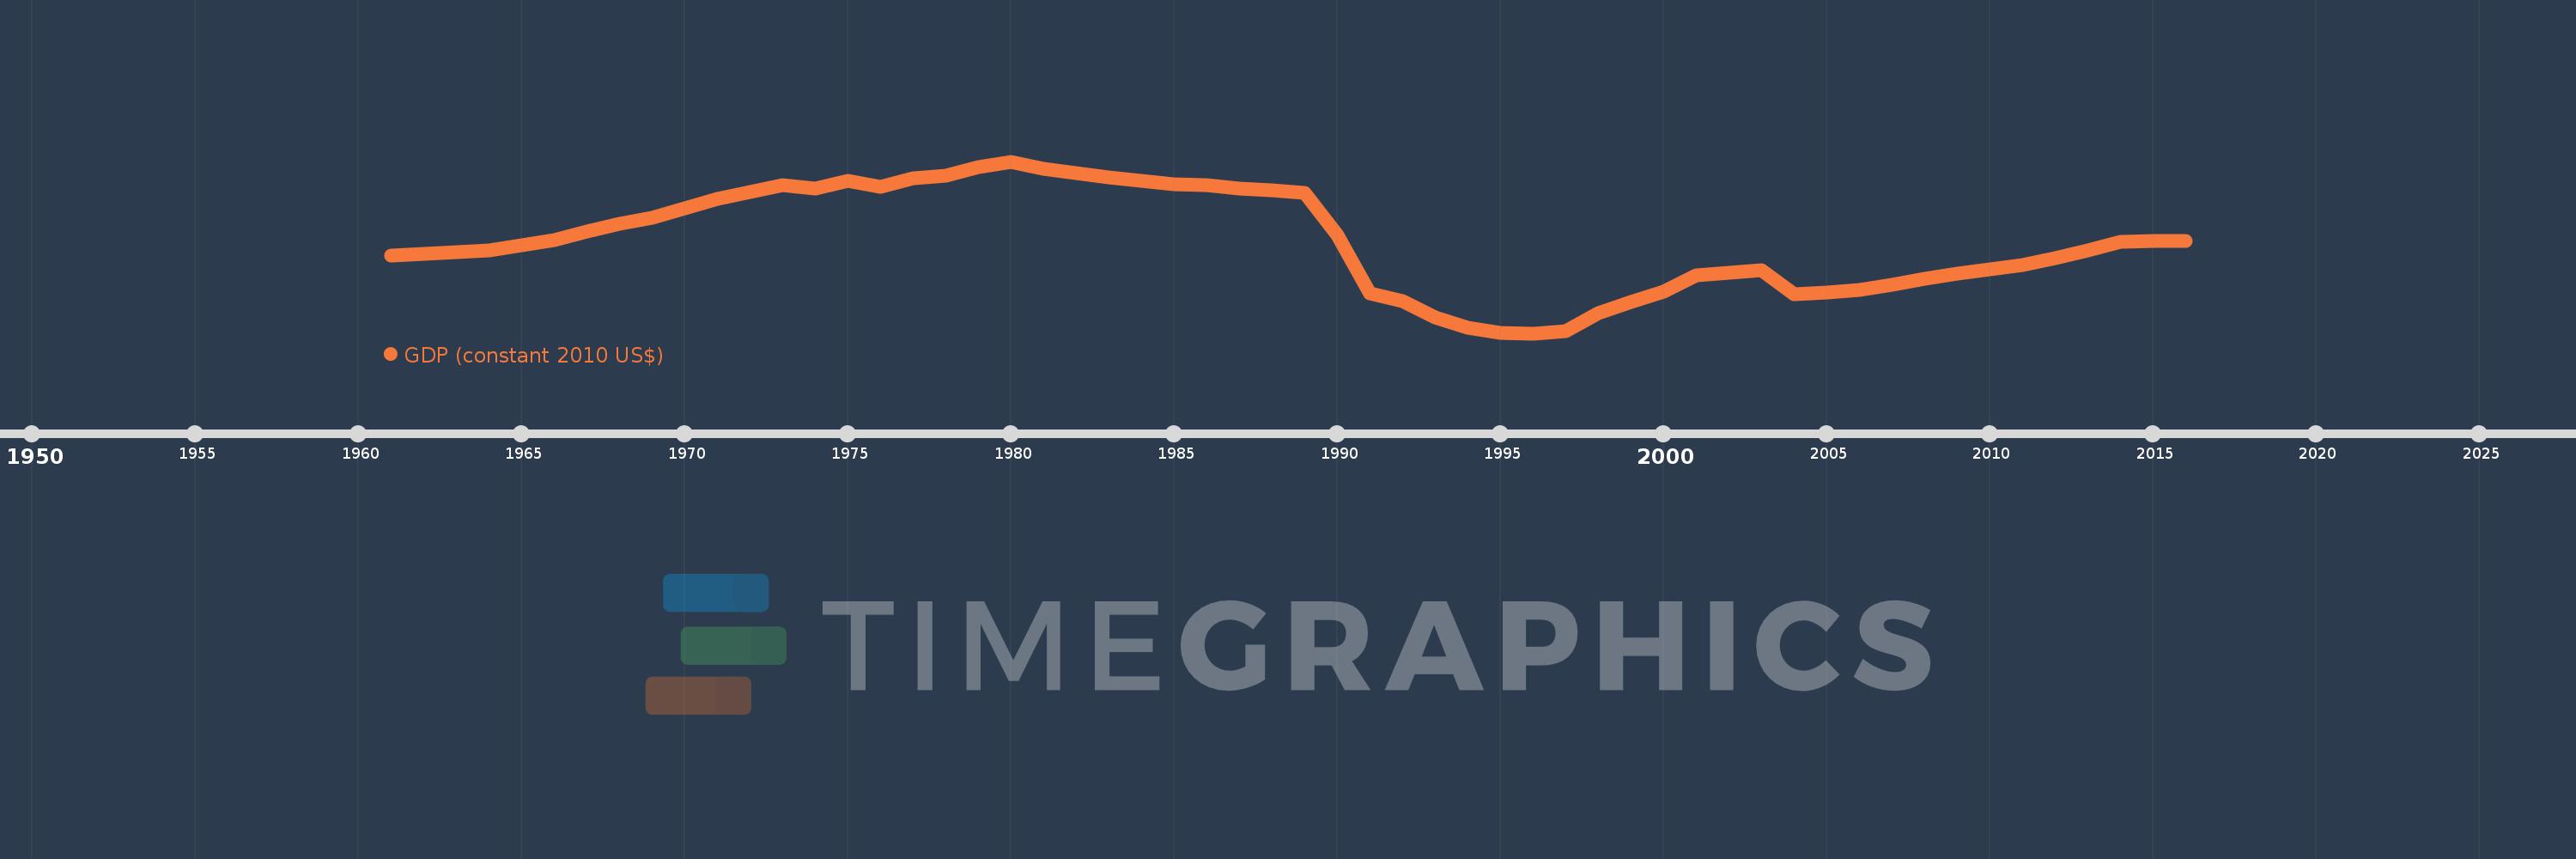
GDP (constant 2010 US$)
2016,2015,2014,2013,2012,2011,2010,2009,2008,2007,2006,2005,2004,2003,2002,2001,2000,1999,1998,1997,1996,1995,1994,1993,1992,1991,1990,1989,1988,1987,1986,1985,1984,1983,1982,1981,1980,1979,1978,1977,1976,1975,1974,1973,1972,1971,1970,1969,1968,1967,1966,1965,1964,1963,1962,1961
This statistics in other country:
AfghanistanAlbaniaAlgeriaAndorraAngolaAntigua and BarbudaArab WorldArgentinaArmeniaArubaAustraliaAustriaAzerbaijanBahamas, TheBahrainBangladeshBarbadosBelarusBelgiumBelizeBeninBermudaBhutanBoliviaBosnia and HerzegovinaBotswanaBrazilBrunei DarussalamBulgariaBurkina FasoBurundiCabo VerdeCambodiaCameroonCanadaCaribbean small statesCentral African RepublicCentral Europe and the BalticsChadChileChinaColombiaComorosCongo, Dem. Rep.Congo, Rep.Costa RicaCote d'IvoireCroatiaCubaCyprusCzech RepublicDenmarkDjiboutiDominicaDominican RepublicEarly-demographic dividendEast Asia & PacificEast Asia & Pacific (excluding high income)East Asia & Pacific (IDA & IBRD countries)EcuadorEgypt, Arab Rep.El SalvadorEquatorial GuineaEritreaEstoniaEthiopiaEuro areaEurope & Central AsiaEurope & Central Asia (excluding high income)Europe & Central Asia (IDA & IBRD countries)European UnionFaroe IslandsFijiFinlandFragile and conflict affected situationsFranceGabonGambia, TheGeorgiaGermanyGhanaGreeceGreenlandGrenadaGuatemalaGuineaGuinea-BissauGuyanaHaitiHeavily indebted poor countries (HIPC)High incomeHondurasHong Kong SAR, ChinaHungaryIBRD onlyIcelandIDA & IBRD totalIDA blendIDA onlyIDA totalIndiaIndonesiaIran, Islamic Rep.IraqIrelandIsle of ManIsraelItalyJamaicaJapanJordanKazakhstanKenyaKiribatiKorea, Rep.KosovoKuwaitKyrgyz RepublicLao PDRLate-demographic dividendLatin America & Caribbean Latin America & Caribbean (excluding high income)Latin America & the Caribbean (IDA & IBRD countries)LatviaLeast developed countries: UN classificationLebanonLesothoLiberiaLibyaLiechtensteinLithuaniaLow & middle incomeLow incomeLower middle incomeLuxembourgMacao SAR, ChinaMacedonia, FYRMadagascarMalawiMalaysiaMaldivesMaliMaltaMarshall IslandsMauritaniaMauritiusMexicoMicronesia, Fed. Sts.Middle East & North AfricaMiddle East & North Africa (excluding high income)Middle East & North Africa (IDA & IBRD countries)Middle incomeMoldovaMonacoMongoliaMontenegroMoroccoMozambiqueMyanmarNamibiaNauruNepalNetherlandsNew ZealandNicaraguaNigerNigeriaNorth AmericaNorwayOECD membersOmanOther small statesPacific island small statesPakistanPalauPanamaPapua New GuineaParaguayPeruPhilippinesPolandPortugalPost-demographic dividendPre-demographic dividendPuerto RicoQatarRomaniaRussian FederationRwandaSamoaSao Tome and PrincipeSaudi ArabiaSenegalSerbiaSeychellesSierra LeoneSingaporeSlovak RepublicSloveniaSmall statesSolomon IslandsSouth AfricaSouth AsiaSouth Asia (IDA & IBRD)South SudanSpainSri LankaSt. Kitts and NevisSt. LuciaSt. Vincent and the GrenadinesSub-Saharan Africa Sub-Saharan Africa (excluding high income)Sub-Saharan Africa (IDA & IBRD countries)SudanSurinameSwazilandSwedenSwitzerlandTajikistanTanzaniaThailandTimor-LesteTogoTongaTrinidad and TobagoTunisiaTurkeyTurkmenistanTuvaluUgandaUkraineUnited Arab EmiratesUnited KingdomUnited StatesUpper middle incomeUruguayUzbekistanVanuatuVenezuela, RBVietnamWest Bank and GazaWorldYemen, Rep.ZambiaZimbabwe Timeline:
This timeline shows a graph from 1961 to 2016 of Liberia. No data until 1960. Number of actual observations by date: 56.
Source name:
World Development Indicators
Source organization:
World Bank national accounts data, and OECD National Accounts data files.
Categories, topics:
Economy & Growth
Last updated:
apr 23, 2017
Indicators value changes by year
Minimum:
240.097 mln
jan 1, 1996
Maximum:
2.877 bln
jan 1, 1980
At the date of observation
Value
Absolute change
Change from previous value
jan 1, 1961
1.427 bln
+1.427 bln
0.0%
jan 1, 1962
1.462 bln
+34.811 mln
2.44%
jan 1, 1963
1.481 bln
+19.652 mln
1.34%
jan 1, 1964
1.515 bln
+33.688 mln
2.27%
jan 1, 1965
1.593 bln
+78.045 mln
5.15%
jan 1, 1966
1.669 bln
+76.36 mln
4.79%
jan 1, 1967
1.798 bln
+128.577 mln
7.7%
jan 1, 1968
1.919 bln
+121.278 mln
6.75%
jan 1, 1969
2.011 bln
+91.52 mln
4.77%
jan 1, 1970
2.157 bln
+146.544 mln
7.29%
jan 1, 1971
2.301 bln
+143.737 mln
6.66%
jan 1, 1972
2.414 bln
+112.856 mln
4.9%
jan 1, 1973
2.514 bln
+99.942 mln
4.14%
jan 1, 1974
2.457 bln
-56.709 mln
-2.26%
jan 1, 1975
2.574 bln
+116.786 mln
4.75%
jan 1, 1976
2.485 bln
-89.274 mln
-3.47%
jan 1, 1977
2.616 bln
+131.946 mln
5.31%
jan 1, 1978
2.658 bln
+41.549 mln
1.59%
jan 1, 1979
2.786 bln
+128.016 mln
4.82%
jan 1, 1980
2.877 bln
+90.959 mln
3.26%
jan 1, 1981
2.759 bln
-117.909 mln
-4.1%
jan 1, 1982
2.7 bln
-58.955 mln
-2.14%
jan 1, 1983
2.634 bln
-65.692 mln
-2.43%
jan 1, 1984
2.584 bln
-49.971 mln
-1.9%
jan 1, 1985
2.53 bln
-54.463 mln
-2.11%
jan 1, 1986
2.509 bln
-21.336 mln
-0.84%
jan 1, 1987
2.467 bln
-42.11 mln
-1.68%
jan 1, 1988
2.442 bln
-24.705 mln
-1.0%
jan 1, 1989
2.392 bln
-49.86 mln
-2.04%
jan 1, 1990
1.754 bln
-637.905 mln
-26.67%
jan 1, 1991
858.957 mln
-895.121 mln
-51.03%
jan 1, 1992
736.768 mln
-122.188 mln
-14.23%
jan 1, 1993
478.268 mln
-258.5 mln
-35.09%
jan 1, 1994
320.557 mln
-157.711 mln
-32.98%
jan 1, 1995
250.797 mln
-69.761 mln
-21.76%
jan 1, 1996
240.097 mln
-10.7 mln
-4.27%
jan 1, 1997
269.2 mln
+29.103 mln
12.12%
jan 1, 1998
555.305 mln
+286.105 mln
106.28%
jan 1, 1999
723.052 mln
+167.747 mln
30.21%
jan 1, 2000
880.254 mln
+157.202 mln
21.74%
jan 1, 2001
1.132 bln
+251.893 mln
28.62%
jan 1, 2002
1.165 bln
+33.044 mln
2.92%
jan 1, 2003
1.209 bln
+43.843 mln
3.76%
jan 1, 2004
844.568 mln
-364.466 mln
-30.15%
jan 1, 2005
866.701 mln
+22.133 mln
2.62%
jan 1, 2006
912.48 mln
+45.779 mln
5.28%
jan 1, 2007
985.872 mln
+73.392 mln
8.04%
jan 1, 2008
1.08 bln
+94.002 mln
9.53%
jan 1, 2009
1.157 bln
+77.178 mln
7.15%
jan 1, 2010
1.218 bln
+61.325 mln
5.3%
jan 1, 2011
1.293 bln
+74.32 mln
6.1%
jan 1, 2012
1.399 bln
+106.001 mln
8.2%
jan 1, 2013
1.511 bln
+111.818 mln
7.99%
jan 1, 2014
1.642 bln
+131.473 mln
8.7%
jan 1, 2015
1.654 bln
+11.513 mln
0.7%
jan 1, 2016
1.654 bln
0.0
0.0%
Ranking of countries by current statistics by years


Comments: