29
/
en
AIzaSyAYiBZKx7MnpbEhh9jyipgxe19OcubqV5w
April 1, 2024
28121
East Asia & Pacific (excluding high income)
EAP
false
2
1
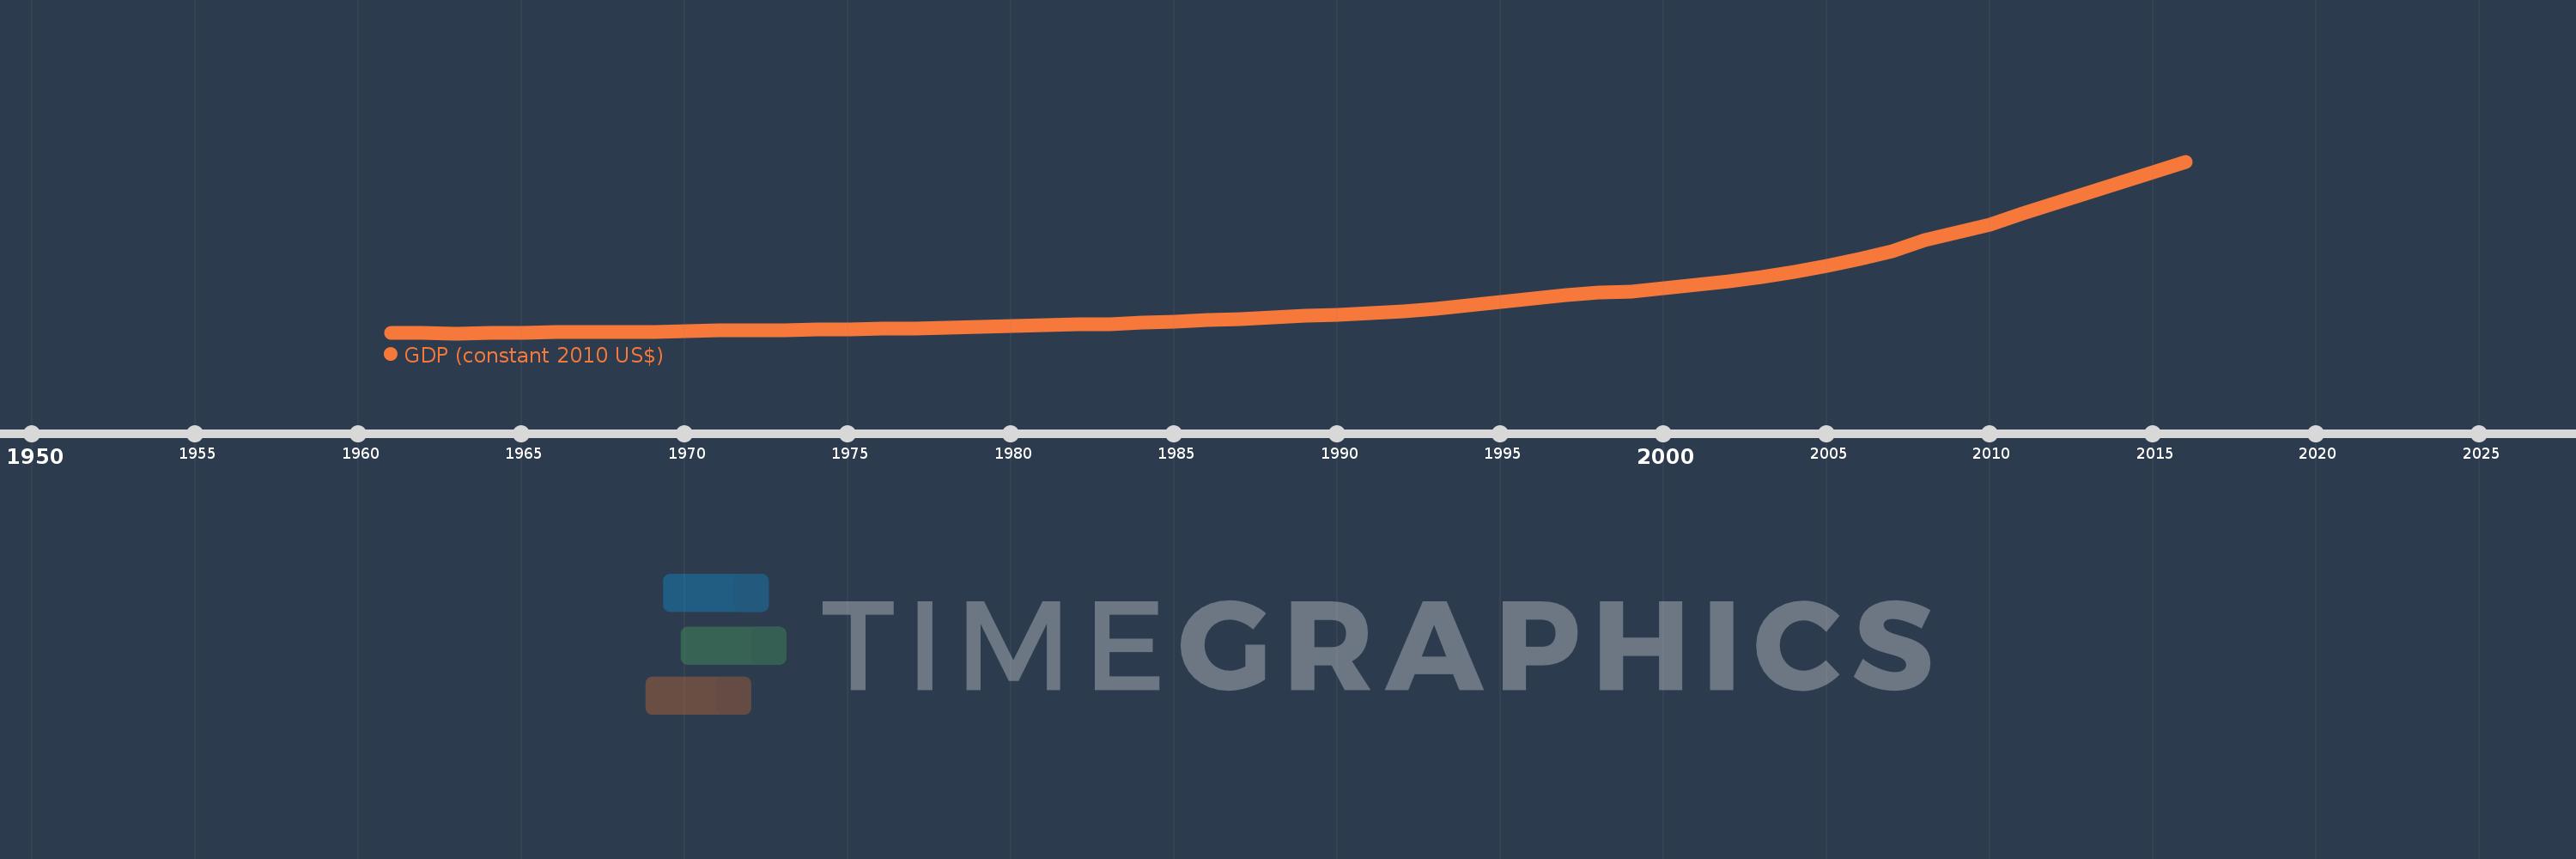
GDP (constant 2010 US$)
2016,2015,2014,2013,2012,2011,2010,2009,2008,2007,2006,2005,2004,2003,2002,2001,2000,1999,1998,1997,1996,1995,1994,1993,1992,1991,1990,1989,1988,1987,1986,1985,1984,1983,1982,1981,1980,1979,1978,1977,1976,1975,1974,1973,1972,1971,1970,1969,1968,1967,1966,1965,1964,1963,1962,1961
This statistics in other country:
AfghanistanAlbaniaAlgeriaAndorraAngolaAntigua and BarbudaArab WorldArgentinaArmeniaArubaAustraliaAustriaAzerbaijanBahamas, TheBahrainBangladeshBarbadosBelarusBelgiumBelizeBeninBermudaBhutanBoliviaBosnia and HerzegovinaBotswanaBrazilBrunei DarussalamBulgariaBurkina FasoBurundiCabo VerdeCambodiaCameroonCanadaCaribbean small statesCentral African RepublicCentral Europe and the BalticsChadChileChinaColombiaComorosCongo, Dem. Rep.Congo, Rep.Costa RicaCote d'IvoireCroatiaCubaCyprusCzech RepublicDenmarkDjiboutiDominicaDominican RepublicEarly-demographic dividendEast Asia & PacificEast Asia & Pacific (excluding high income)East Asia & Pacific (IDA & IBRD countries)EcuadorEgypt, Arab Rep.El SalvadorEquatorial GuineaEritreaEstoniaEthiopiaEuro areaEurope & Central AsiaEurope & Central Asia (excluding high income)Europe & Central Asia (IDA & IBRD countries)European UnionFaroe IslandsFijiFinlandFragile and conflict affected situationsFranceGabonGambia, TheGeorgiaGermanyGhanaGreeceGreenlandGrenadaGuatemalaGuineaGuinea-BissauGuyanaHaitiHeavily indebted poor countries (HIPC)High incomeHondurasHong Kong SAR, ChinaHungaryIBRD onlyIcelandIDA & IBRD totalIDA blendIDA onlyIDA totalIndiaIndonesiaIran, Islamic Rep.IraqIrelandIsle of ManIsraelItalyJamaicaJapanJordanKazakhstanKenyaKiribatiKorea, Rep.KosovoKuwaitKyrgyz RepublicLao PDRLate-demographic dividendLatin America & Caribbean Latin America & Caribbean (excluding high income)Latin America & the Caribbean (IDA & IBRD countries)LatviaLeast developed countries: UN classificationLebanonLesothoLiberiaLibyaLiechtensteinLithuaniaLow & middle incomeLow incomeLower middle incomeLuxembourgMacao SAR, ChinaMacedonia, FYRMadagascarMalawiMalaysiaMaldivesMaliMaltaMarshall IslandsMauritaniaMauritiusMexicoMicronesia, Fed. Sts.Middle East & North AfricaMiddle East & North Africa (excluding high income)Middle East & North Africa (IDA & IBRD countries)Middle incomeMoldovaMonacoMongoliaMontenegroMoroccoMozambiqueMyanmarNamibiaNauruNepalNetherlandsNew ZealandNicaraguaNigerNigeriaNorth AmericaNorwayOECD membersOmanOther small statesPacific island small statesPakistanPalauPanamaPapua New GuineaParaguayPeruPhilippinesPolandPortugalPost-demographic dividendPre-demographic dividendPuerto RicoQatarRomaniaRussian FederationRwandaSamoaSao Tome and PrincipeSaudi ArabiaSenegalSerbiaSeychellesSierra LeoneSingaporeSlovak RepublicSloveniaSmall statesSolomon IslandsSouth AfricaSouth AsiaSouth Asia (IDA & IBRD)South SudanSpainSri LankaSt. Kitts and NevisSt. LuciaSt. Vincent and the GrenadinesSub-Saharan Africa Sub-Saharan Africa (excluding high income)Sub-Saharan Africa (IDA & IBRD countries)SudanSurinameSwazilandSwedenSwitzerlandTajikistanTanzaniaThailandTimor-LesteTogoTongaTrinidad and TobagoTunisiaTurkeyTurkmenistanTuvaluUgandaUkraineUnited Arab EmiratesUnited KingdomUnited StatesUpper middle incomeUruguayUzbekistanVanuatuVenezuela, RBVietnamWest Bank and GazaWorldYemen, Rep.ZambiaZimbabwe Timeline:
This timeline shows a graph from 1961 to 2016 of East Asia & Pacific (excluding high income). No data until 1960. Number of actual observations by date: 56.
Source name:
World Development Indicators
Source organization:
World Bank national accounts data, and OECD National Accounts data files.
Categories, topics:
Economy & Growth
Last updated:
apr 23, 2017
Indicators value changes by year
Minimum:
217.64 bln
jan 1, 1963
Maximum:
11.193 trl
jan 1, 2016
At the date of observation
Value
Absolute change
Change from previous value
jan 1, 1961
247.479 bln
+247.479 bln
0.0%
jan 1, 1962
218.111 bln
-29.368 bln
-11.87%
jan 1, 1963
217.64 bln
-470.982 mln
-0.22%
jan 1, 1964
231.047 bln
+13.407 bln
6.16%
jan 1, 1965
254.462 bln
+23.416 bln
10.13%
jan 1, 1966
280.463 bln
+26.0 bln
10.22%
jan 1, 1967
302.284 bln
+21.821 bln
7.78%
jan 1, 1968
299.022 bln
-3.262 bln
-1.08%
jan 1, 1969
306.733 bln
+7.712 bln
2.58%
jan 1, 1970
340.568 bln
+33.834 bln
11.03%
jan 1, 1971
384.991 bln
+44.424 bln
13.04%
jan 1, 1972
410.131 bln
+25.14 bln
6.53%
jan 1, 1973
431.515 bln
+21.384 bln
5.21%
jan 1, 1974
469.002 bln
+37.487 bln
8.69%
jan 1, 1975
489.332 bln
+20.33 bln
4.33%
jan 1, 1976
522.549 bln
+33.218 bln
6.79%
jan 1, 1977
538.95 bln
+16.4 bln
3.14%
jan 1, 1978
580.561 bln
+41.611 bln
7.72%
jan 1, 1979
637.179 bln
+56.619 bln
9.75%
jan 1, 1980
682.398 bln
+45.219 bln
7.1%
jan 1, 1981
732.43 bln
+50.032 bln
7.33%
jan 1, 1982
775.06 bln
+42.631 bln
5.82%
jan 1, 1983
820.644 bln
+45.584 bln
5.88%
jan 1, 1984
889.541 bln
+68.897 bln
8.4%
jan 1, 1985
974.511 bln
+84.97 bln
9.55%
jan 1, 1986
1.048 trl
+73.258 bln
7.52%
jan 1, 1987
1.121 trl
+72.954 bln
6.96%
jan 1, 1988
1.221 trl
+100.284 bln
8.95%
jan 1, 1989
1.34 trl
+118.567 bln
9.71%
jan 1, 1990
1.423 trl
+83.445 bln
6.23%
jan 1, 1991
1.505 trl
+81.715 bln
5.74%
jan 1, 1992
1.63 trl
+125.601 bln
8.35%
jan 1, 1993
1.808 trl
+177.954 bln
10.92%
jan 1, 1994
2.008 trl
+199.49 bln
11.03%
jan 1, 1995
2.224 trl
+216.243 bln
10.77%
jan 1, 1996
2.441 trl
+217.378 bln
9.77%
jan 1, 1997
2.659 trl
+217.544 bln
8.91%
jan 1, 1998
2.846 trl
+187.393 bln
7.05%
jan 1, 1999
2.896 trl
+50.155 bln
1.76%
jan 1, 2000
3.074 trl
+177.137 bln
6.12%
jan 1, 2001
3.305 trl
+230.967 bln
7.51%
jan 1, 2002
3.527 trl
+221.964 bln
6.72%
jan 1, 2003
3.804 trl
+277.417 bln
7.87%
jan 1, 2004
4.136 trl
+332.145 bln
8.73%
jan 1, 2005
4.505 trl
+369.201 bln
8.93%
jan 1, 2006
4.943 trl
+437.443 bln
9.71%
jan 1, 2007
5.475 trl
+532.075 bln
10.76%
jan 1, 2008
6.148 trl
+672.754 bln
12.29%
jan 1, 2009
6.663 trl
+515.623 bln
8.39%
jan 1, 2010
7.174 trl
+510.577 bln
7.66%
jan 1, 2011
7.874 trl
+700.611 bln
9.77%
jan 1, 2012
8.542 trl
+667.275 bln
8.47%
jan 1, 2013
9.184 trl
+641.841 bln
7.51%
jan 1, 2014
9.845 trl
+661.893 bln
7.21%
jan 1, 2015
10.511 trl
+665.629 bln
6.76%
jan 1, 2016
11.193 trl
+681.613 bln
6.48%
Ranking of countries by current statistics by years


Comments: