29
/
en
AIzaSyAYiBZKx7MnpbEhh9jyipgxe19OcubqV5w
April 1, 2024
267977
Tunisia
TUN
true
2
1
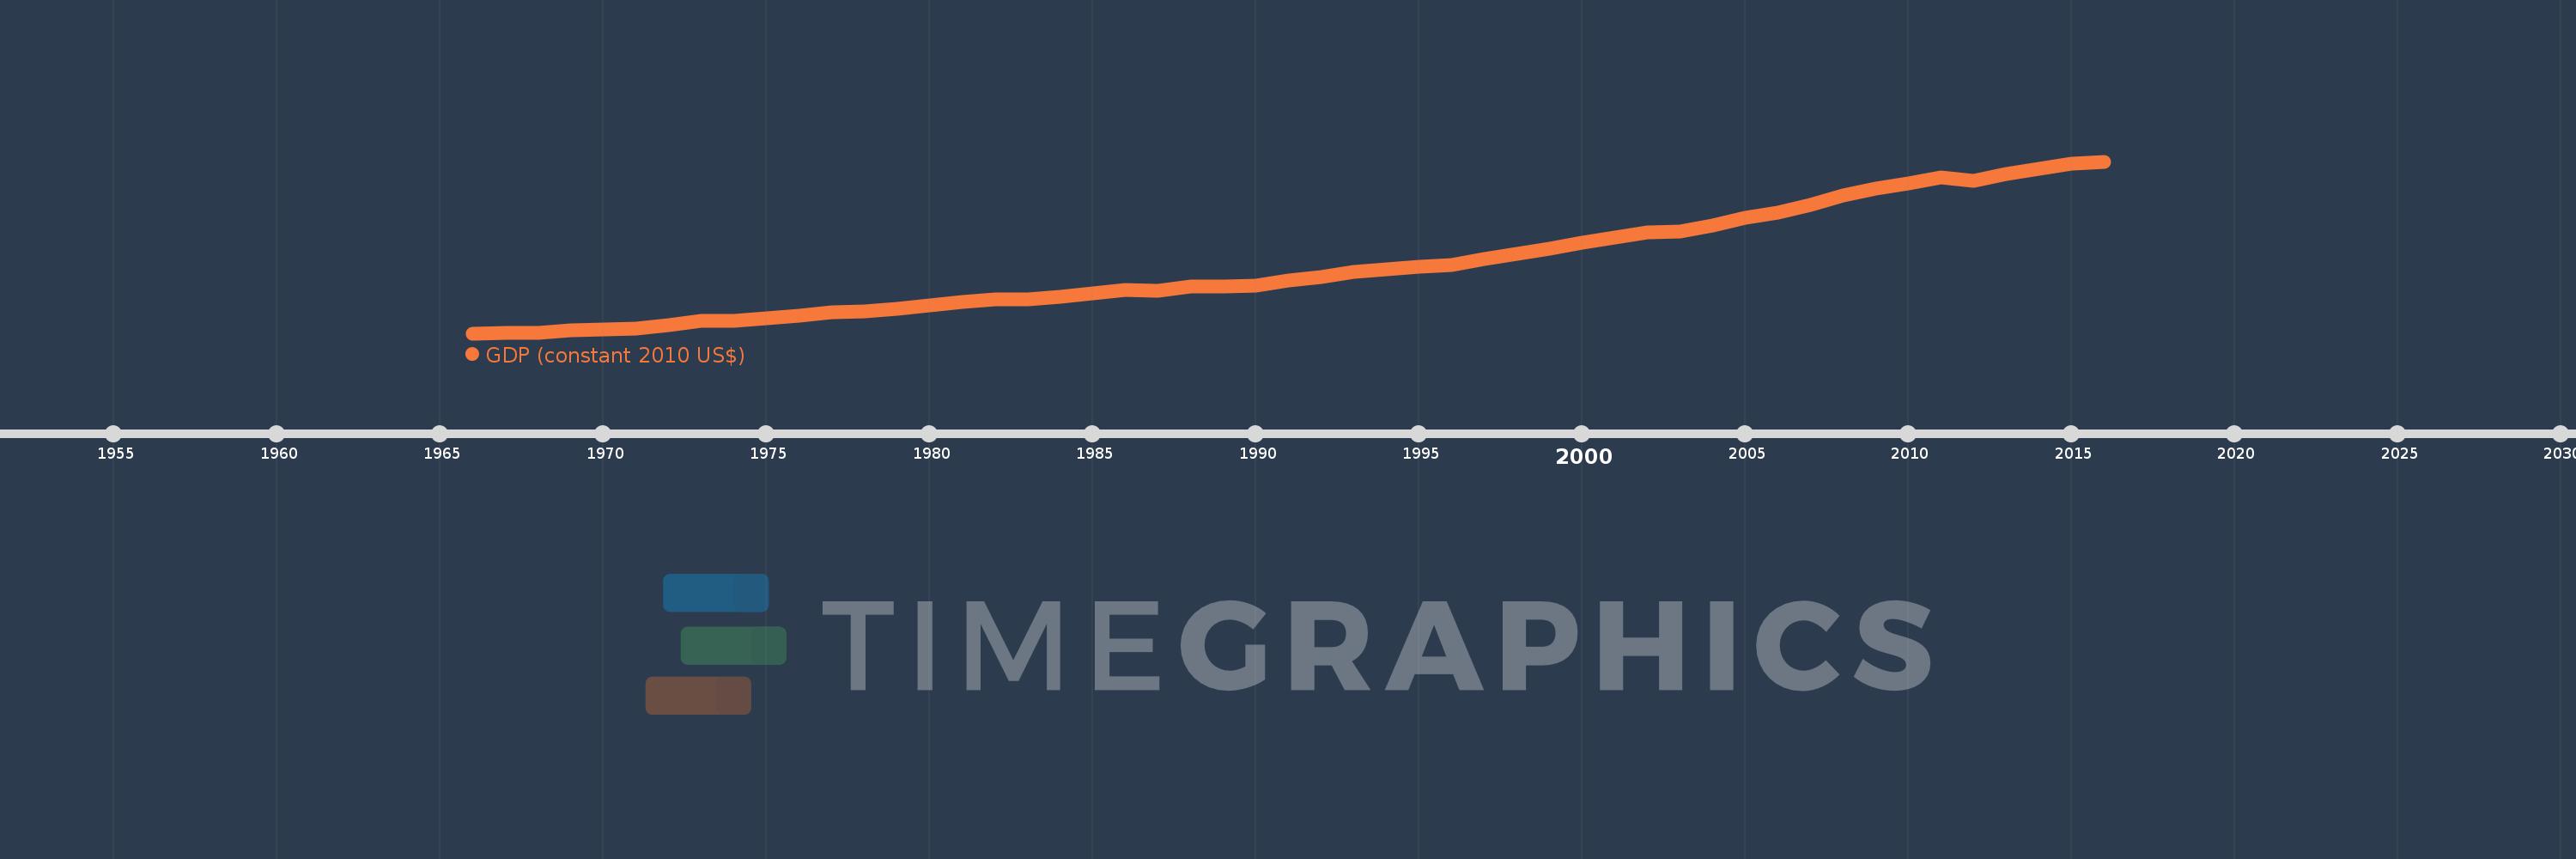
GDP (constant 2010 US$)
2016,2015,2014,2013,2012,2011,2010,2009,2008,2007,2006,2005,2004,2003,2002,2001,2000,1999,1998,1997,1996,1995,1994,1993,1992,1991,1990,1989,1988,1987,1986,1985,1984,1983,1982,1981,1980,1979,1978,1977,1976,1975,1974,1973,1972,1971,1970,1969,1968,1967,1966
This statistics in other country:
AfghanistanAlbaniaAlgeriaAndorraAngolaAntigua and BarbudaArab WorldArgentinaArmeniaArubaAustraliaAustriaAzerbaijanBahamas, TheBahrainBangladeshBarbadosBelarusBelgiumBelizeBeninBermudaBhutanBoliviaBosnia and HerzegovinaBotswanaBrazilBrunei DarussalamBulgariaBurkina FasoBurundiCabo VerdeCambodiaCameroonCanadaCaribbean small statesCentral African RepublicCentral Europe and the BalticsChadChileChinaColombiaComorosCongo, Dem. Rep.Congo, Rep.Costa RicaCote d'IvoireCroatiaCubaCyprusCzech RepublicDenmarkDjiboutiDominicaDominican RepublicEarly-demographic dividendEast Asia & PacificEast Asia & Pacific (excluding high income)East Asia & Pacific (IDA & IBRD countries)EcuadorEgypt, Arab Rep.El SalvadorEquatorial GuineaEritreaEstoniaEthiopiaEuro areaEurope & Central AsiaEurope & Central Asia (excluding high income)Europe & Central Asia (IDA & IBRD countries)European UnionFaroe IslandsFijiFinlandFragile and conflict affected situationsFranceGabonGambia, TheGeorgiaGermanyGhanaGreeceGreenlandGrenadaGuatemalaGuineaGuinea-BissauGuyanaHaitiHeavily indebted poor countries (HIPC)High incomeHondurasHong Kong SAR, ChinaHungaryIBRD onlyIcelandIDA & IBRD totalIDA blendIDA onlyIDA totalIndiaIndonesiaIran, Islamic Rep.IraqIrelandIsle of ManIsraelItalyJamaicaJapanJordanKazakhstanKenyaKiribatiKorea, Rep.KosovoKuwaitKyrgyz RepublicLao PDRLate-demographic dividendLatin America & Caribbean Latin America & Caribbean (excluding high income)Latin America & the Caribbean (IDA & IBRD countries)LatviaLeast developed countries: UN classificationLebanonLesothoLiberiaLibyaLiechtensteinLithuaniaLow & middle incomeLow incomeLower middle incomeLuxembourgMacao SAR, ChinaMacedonia, FYRMadagascarMalawiMalaysiaMaldivesMaliMaltaMarshall IslandsMauritaniaMauritiusMexicoMicronesia, Fed. Sts.Middle East & North AfricaMiddle East & North Africa (excluding high income)Middle East & North Africa (IDA & IBRD countries)Middle incomeMoldovaMonacoMongoliaMontenegroMoroccoMozambiqueMyanmarNamibiaNauruNepalNetherlandsNew ZealandNicaraguaNigerNigeriaNorth AmericaNorwayOECD membersOmanOther small statesPacific island small statesPakistanPalauPanamaPapua New GuineaParaguayPeruPhilippinesPolandPortugalPost-demographic dividendPre-demographic dividendPuerto RicoQatarRomaniaRussian FederationRwandaSamoaSao Tome and PrincipeSaudi ArabiaSenegalSerbiaSeychellesSierra LeoneSingaporeSlovak RepublicSloveniaSmall statesSolomon IslandsSouth AfricaSouth AsiaSouth Asia (IDA & IBRD)South SudanSpainSri LankaSt. Kitts and NevisSt. LuciaSt. Vincent and the GrenadinesSub-Saharan Africa Sub-Saharan Africa (excluding high income)Sub-Saharan Africa (IDA & IBRD countries)SudanSurinameSwazilandSwedenSwitzerlandTajikistanTanzaniaThailandTimor-LesteTogoTongaTrinidad and TobagoTunisiaTurkeyTurkmenistanTuvaluUgandaUkraineUnited Arab EmiratesUnited KingdomUnited StatesUpper middle incomeUruguayUzbekistanVanuatuVenezuela, RBVietnamWest Bank and GazaWorldYemen, Rep.ZambiaZimbabwe Timeline:
This timeline shows a graph from 1966 to 2016 of Tunisia. No data until 1965. Number of actual observations by date: 51.
Source name:
World Development Indicators
Source organization:
World Bank national accounts data, and OECD National Accounts data files.
Categories, topics:
Economy & Growth
Last updated:
apr 23, 2017
Indicators value changes by year
Minimum:
5.06 bln
jan 1, 1966
Maximum:
48.081 bln
jan 1, 2016
At the date of observation
Value
Absolute change
Change from previous value
jan 1, 1966
5.06 bln
+5.06 bln
0.0%
jan 1, 1967
5.235 bln
+174.811 mln
3.45%
jan 1, 1968
5.243 bln
+8.478 mln
0.16%
jan 1, 1969
5.789 bln
+545.795 mln
10.41%
jan 1, 1970
6.064 bln
+274.847 mln
4.75%
jan 1, 1971
6.347 bln
+283.156 mln
4.67%
jan 1, 1972
7.017 bln
+670.248 mln
10.56%
jan 1, 1973
8.262 bln
+1.245 bln
17.74%
jan 1, 1974
8.208 bln
-54.088 mln
-0.65%
jan 1, 1975
8.871 bln
+662.788 mln
8.07%
jan 1, 1976
9.506 bln
+634.811 mln
7.16%
jan 1, 1977
10.254 bln
+748.752 mln
7.88%
jan 1, 1978
10.604 bln
+349.79 mln
3.41%
jan 1, 1979
11.287 bln
+682.965 mln
6.44%
jan 1, 1980
12.029 bln
+741.291 mln
6.57%
jan 1, 1981
12.921 bln
+892.365 mln
7.42%
jan 1, 1982
13.633 bln
+712.467 mln
5.51%
jan 1, 1983
13.566 bln
-67.313 mln
-0.49%
jan 1, 1984
14.201 bln
+635.151 mln
4.68%
jan 1, 1985
15.018 bln
+816.404 mln
5.75%
jan 1, 1986
15.866 bln
+848.28 mln
5.65%
jan 1, 1987
15.636 bln
-229.577 mln
-1.45%
jan 1, 1988
16.684 bln
+1.048 bln
6.7%
jan 1, 1989
16.696 bln
+12.039 mln
0.07%
jan 1, 1990
16.988 bln
+291.632 mln
1.75%
jan 1, 1991
18.338 bln
+1.351 bln
7.95%
jan 1, 1992
19.054 bln
+716.028 mln
3.9%
jan 1, 1993
20.542 bln
+1.487 bln
7.81%
jan 1, 1994
20.991 bln
+449.827 mln
2.19%
jan 1, 1995
21.659 bln
+667.196 mln
3.18%
jan 1, 1996
22.168 bln
+509.341 mln
2.35%
jan 1, 1997
23.752 bln
+1.584 bln
7.15%
jan 1, 1998
25.045 bln
+1.292 bln
5.44%
jan 1, 1999
26.243 bln
+1.198 bln
4.78%
jan 1, 2000
27.831 bln
+1.589 bln
6.05%
jan 1, 2001
29.142 bln
+1.311 bln
4.71%
jan 1, 2002
30.249 bln
+1.106 bln
3.8%
jan 1, 2003
30.649 bln
+400.057 mln
1.32%
jan 1, 2004
32.09 bln
+1.441 bln
4.7%
jan 1, 2005
34.091 bln
+2.001 bln
6.24%
jan 1, 2006
35.28 bln
+1.189 bln
3.49%
jan 1, 2007
37.13 bln
+1.85 bln
5.24%
jan 1, 2008
39.621 bln
+2.491 bln
6.71%
jan 1, 2009
41.3 bln
+1.679 bln
4.24%
jan 1, 2010
42.557 bln
+1.257 bln
3.04%
jan 1, 2011
44.051 bln
+1.494 bln
3.51%
jan 1, 2012
43.206 bln
-844.535 mln
-1.92%
jan 1, 2013
44.934 bln
+1.727 bln
4.0%
jan 1, 2014
46.28 bln
+1.346 bln
3.0%
jan 1, 2015
47.607 bln
+1.327 bln
2.87%
jan 1, 2016
48.081 bln
+473.52 mln
0.99%
Ranking of countries by current statistics by years


Comments: