29
/
en
AIzaSyAYiBZKx7MnpbEhh9jyipgxe19OcubqV5w
April 1, 2024
176385
Lebanon
LBN
true
2
1
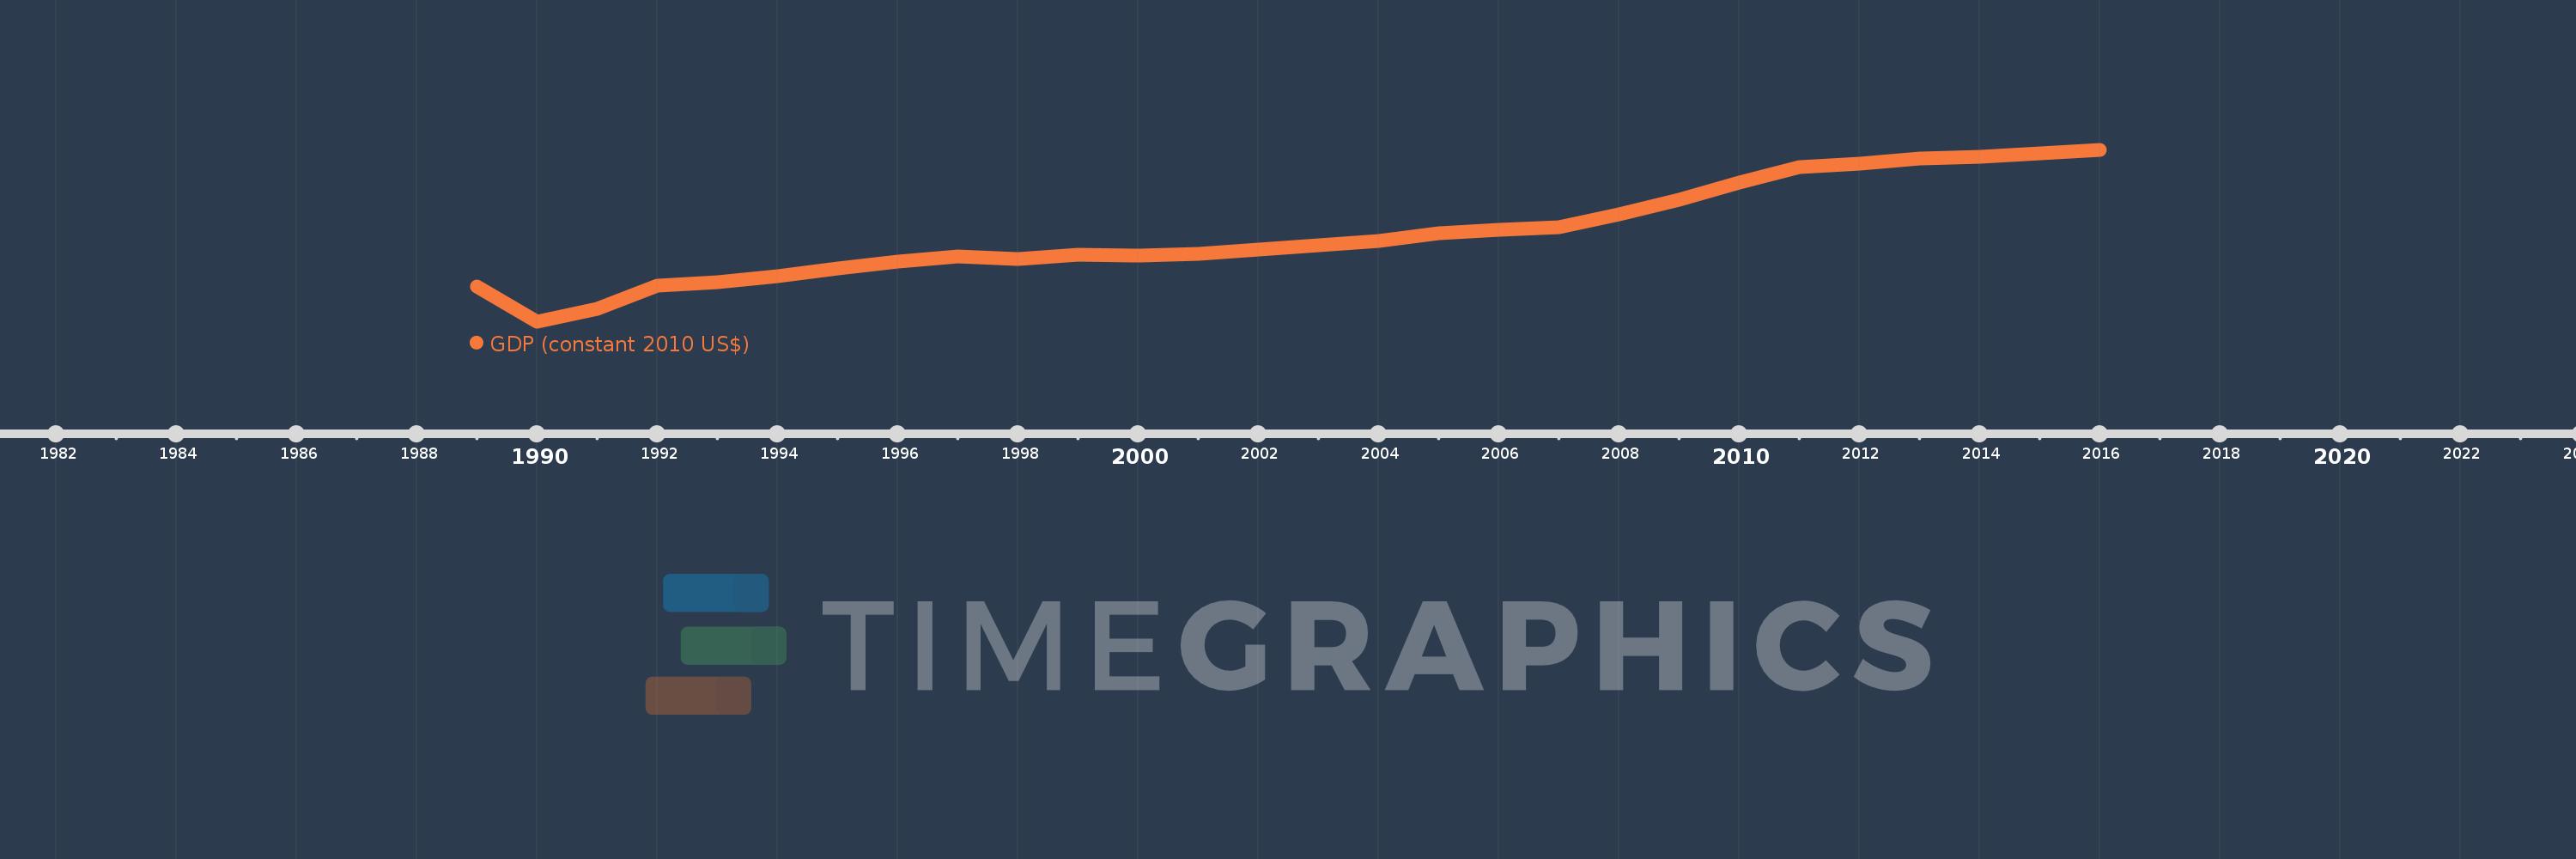
GDP (constant 2010 US$)
2016,2015,2014,2013,2012,2011,2010,2009,2008,2007,2006,2005,2004,2003,2002,2001,2000,1999,1998,1997,1996,1995,1994,1993,1992,1991,1990,1989
This statistics in other country:
AfghanistanAlbaniaAlgeriaAndorraAngolaAntigua and BarbudaArab WorldArgentinaArmeniaArubaAustraliaAustriaAzerbaijanBahamas, TheBahrainBangladeshBarbadosBelarusBelgiumBelizeBeninBermudaBhutanBoliviaBosnia and HerzegovinaBotswanaBrazilBrunei DarussalamBulgariaBurkina FasoBurundiCabo VerdeCambodiaCameroonCanadaCaribbean small statesCentral African RepublicCentral Europe and the BalticsChadChileChinaColombiaComorosCongo, Dem. Rep.Congo, Rep.Costa RicaCote d'IvoireCroatiaCubaCyprusCzech RepublicDenmarkDjiboutiDominicaDominican RepublicEarly-demographic dividendEast Asia & PacificEast Asia & Pacific (excluding high income)East Asia & Pacific (IDA & IBRD countries)EcuadorEgypt, Arab Rep.El SalvadorEquatorial GuineaEritreaEstoniaEthiopiaEuro areaEurope & Central AsiaEurope & Central Asia (excluding high income)Europe & Central Asia (IDA & IBRD countries)European UnionFaroe IslandsFijiFinlandFragile and conflict affected situationsFranceGabonGambia, TheGeorgiaGermanyGhanaGreeceGreenlandGrenadaGuatemalaGuineaGuinea-BissauGuyanaHaitiHeavily indebted poor countries (HIPC)High incomeHondurasHong Kong SAR, ChinaHungaryIBRD onlyIcelandIDA & IBRD totalIDA blendIDA onlyIDA totalIndiaIndonesiaIran, Islamic Rep.IraqIrelandIsle of ManIsraelItalyJamaicaJapanJordanKazakhstanKenyaKiribatiKorea, Rep.KosovoKuwaitKyrgyz RepublicLao PDRLate-demographic dividendLatin America & Caribbean Latin America & Caribbean (excluding high income)Latin America & the Caribbean (IDA & IBRD countries)LatviaLeast developed countries: UN classificationLebanonLesothoLiberiaLibyaLiechtensteinLithuaniaLow & middle incomeLow incomeLower middle incomeLuxembourgMacao SAR, ChinaMacedonia, FYRMadagascarMalawiMalaysiaMaldivesMaliMaltaMarshall IslandsMauritaniaMauritiusMexicoMicronesia, Fed. Sts.Middle East & North AfricaMiddle East & North Africa (excluding high income)Middle East & North Africa (IDA & IBRD countries)Middle incomeMoldovaMonacoMongoliaMontenegroMoroccoMozambiqueMyanmarNamibiaNauruNepalNetherlandsNew ZealandNicaraguaNigerNigeriaNorth AmericaNorwayOECD membersOmanOther small statesPacific island small statesPakistanPalauPanamaPapua New GuineaParaguayPeruPhilippinesPolandPortugalPost-demographic dividendPre-demographic dividendPuerto RicoQatarRomaniaRussian FederationRwandaSamoaSao Tome and PrincipeSaudi ArabiaSenegalSerbiaSeychellesSierra LeoneSingaporeSlovak RepublicSloveniaSmall statesSolomon IslandsSouth AfricaSouth AsiaSouth Asia (IDA & IBRD)South SudanSpainSri LankaSt. Kitts and NevisSt. LuciaSt. Vincent and the GrenadinesSub-Saharan Africa Sub-Saharan Africa (excluding high income)Sub-Saharan Africa (IDA & IBRD countries)SudanSurinameSwazilandSwedenSwitzerlandTajikistanTanzaniaThailandTimor-LesteTogoTongaTrinidad and TobagoTunisiaTurkeyTurkmenistanTuvaluUgandaUkraineUnited Arab EmiratesUnited KingdomUnited StatesUpper middle incomeUruguayUzbekistanVanuatuVenezuela, RBVietnamWest Bank and GazaWorldYemen, Rep.ZambiaZimbabwe Timeline:
This timeline shows a graph from 1989 to 2016 of Lebanon. No data until 1988. Number of actual observations by date: 28.
Source name:
World Development Indicators
Source organization:
World Bank national accounts data, and OECD National Accounts data files.
Categories, topics:
Economy & Growth
Last updated:
apr 23, 2017
Indicators value changes by year
Minimum:
9.038 bln
jan 1, 1990
Maximum:
41.221 bln
jan 1, 2016
At the date of observation
Value
Absolute change
Change from previous value
jan 1, 1989
15.705 bln
+15.705 bln
0.0%
jan 1, 1990
9.038 bln
-6.667 bln
-42.45%
jan 1, 1991
11.436 bln
+2.398 bln
26.53%
jan 1, 1992
15.805 bln
+4.369 bln
38.2%
jan 1, 1993
16.516 bln
+711.212 mln
4.5%
jan 1, 1994
17.672 bln
+1.156 bln
7.0%
jan 1, 1995
19.086 bln
+1.414 bln
8.0%
jan 1, 1996
20.334 bln
+1.247 bln
6.53%
jan 1, 1997
21.378 bln
+1.044 bln
5.14%
jan 1, 1998
20.889 bln
-488.868 mln
-2.29%
jan 1, 1999
21.64 bln
+750.471 mln
3.59%
jan 1, 2000
21.542 bln
-98.043 mln
-0.45%
jan 1, 2001
21.831 bln
+289.533 mln
1.34%
jan 1, 2002
22.676 bln
+845.137 mln
3.87%
jan 1, 2003
23.451 bln
+774.416 mln
3.42%
jan 1, 2004
24.206 bln
+755.69 mln
3.22%
jan 1, 2005
25.638 bln
+1.432 bln
5.91%
jan 1, 2006
26.338 bln
+700.498 mln
2.73%
jan 1, 2007
26.748 bln
+409.95 mln
1.56%
jan 1, 2008
29.249 bln
+2.501 bln
9.35%
jan 1, 2009
31.918 bln
+2.669 bln
9.13%
jan 1, 2010
35.207 bln
+3.289 bln
10.3%
jan 1, 2011
38.01 bln
+2.803 bln
7.96%
jan 1, 2012
38.764 bln
+753.566 mln
1.98%
jan 1, 2013
39.616 bln
+852.797 mln
2.2%
jan 1, 2014
39.973 bln
+356.547 mln
0.9%
jan 1, 2015
40.692 bln
+719.511 mln
1.8%
jan 1, 2016
41.221 bln
+529.001 mln
1.3%
Ranking of countries by current statistics by years


Comments: