29
/
en
AIzaSyAYiBZKx7MnpbEhh9jyipgxe19OcubqV5w
April 1, 2024
271429
Tuvalu
TUV
true
2
1
GDP (constant 2010 US$)
2016,2015,2014,2013,2012,2011,2010,2009,2008,2007,2006,2005,2004,2003,2002,2001,2000,1999,1998,1997,1996,1995,1994,1993,1992,1991
This statistics in other country:
AfghanistanAlbaniaAlgeriaAndorraAngolaAntigua and BarbudaArab WorldArgentinaArmeniaArubaAustraliaAustriaAzerbaijanBahamas, TheBahrainBangladeshBarbadosBelarusBelgiumBelizeBeninBermudaBhutanBoliviaBosnia and HerzegovinaBotswanaBrazilBrunei DarussalamBulgariaBurkina FasoBurundiCabo VerdeCambodiaCameroonCanadaCaribbean small statesCentral African RepublicCentral Europe and the BalticsChadChileChinaColombiaComorosCongo, Dem. Rep.Congo, Rep.Costa RicaCote d'IvoireCroatiaCubaCyprusCzech RepublicDenmarkDjiboutiDominicaDominican RepublicEarly-demographic dividendEast Asia & PacificEast Asia & Pacific (excluding high income)East Asia & Pacific (IDA & IBRD countries)EcuadorEgypt, Arab Rep.El SalvadorEquatorial GuineaEritreaEstoniaEthiopiaEuro areaEurope & Central AsiaEurope & Central Asia (excluding high income)Europe & Central Asia (IDA & IBRD countries)European UnionFaroe IslandsFijiFinlandFragile and conflict affected situationsFranceGabonGambia, TheGeorgiaGermanyGhanaGreeceGreenlandGrenadaGuatemalaGuineaGuinea-BissauGuyanaHaitiHeavily indebted poor countries (HIPC)High incomeHondurasHong Kong SAR, ChinaHungaryIBRD onlyIcelandIDA & IBRD totalIDA blendIDA onlyIDA totalIndiaIndonesiaIran, Islamic Rep.IraqIrelandIsle of ManIsraelItalyJamaicaJapanJordanKazakhstanKenyaKiribatiKorea, Rep.KosovoKuwaitKyrgyz RepublicLao PDRLate-demographic dividendLatin America & Caribbean Latin America & Caribbean (excluding high income)Latin America & the Caribbean (IDA & IBRD countries)LatviaLeast developed countries: UN classificationLebanonLesothoLiberiaLibyaLiechtensteinLithuaniaLow & middle incomeLow incomeLower middle incomeLuxembourgMacao SAR, ChinaMacedonia, FYRMadagascarMalawiMalaysiaMaldivesMaliMaltaMarshall IslandsMauritaniaMauritiusMexicoMicronesia, Fed. Sts.Middle East & North AfricaMiddle East & North Africa (excluding high income)Middle East & North Africa (IDA & IBRD countries)Middle incomeMoldovaMonacoMongoliaMontenegroMoroccoMozambiqueMyanmarNamibiaNauruNepalNetherlandsNew ZealandNicaraguaNigerNigeriaNorth AmericaNorwayOECD membersOmanOther small statesPacific island small statesPakistanPalauPanamaPapua New GuineaParaguayPeruPhilippinesPolandPortugalPost-demographic dividendPre-demographic dividendPuerto RicoQatarRomaniaRussian FederationRwandaSamoaSao Tome and PrincipeSaudi ArabiaSenegalSerbiaSeychellesSierra LeoneSingaporeSlovak RepublicSloveniaSmall statesSolomon IslandsSouth AfricaSouth AsiaSouth Asia (IDA & IBRD)South SudanSpainSri LankaSt. Kitts and NevisSt. LuciaSt. Vincent and the GrenadinesSub-Saharan Africa Sub-Saharan Africa (excluding high income)Sub-Saharan Africa (IDA & IBRD countries)SudanSurinameSwazilandSwedenSwitzerlandTajikistanTanzaniaThailandTimor-LesteTogoTongaTrinidad and TobagoTunisiaTurkeyTurkmenistanTuvaluUgandaUkraineUnited Arab EmiratesUnited KingdomUnited StatesUpper middle incomeUruguayUzbekistanVanuatuVenezuela, RBVietnamWest Bank and GazaWorldYemen, Rep.ZambiaZimbabwe Timeline:
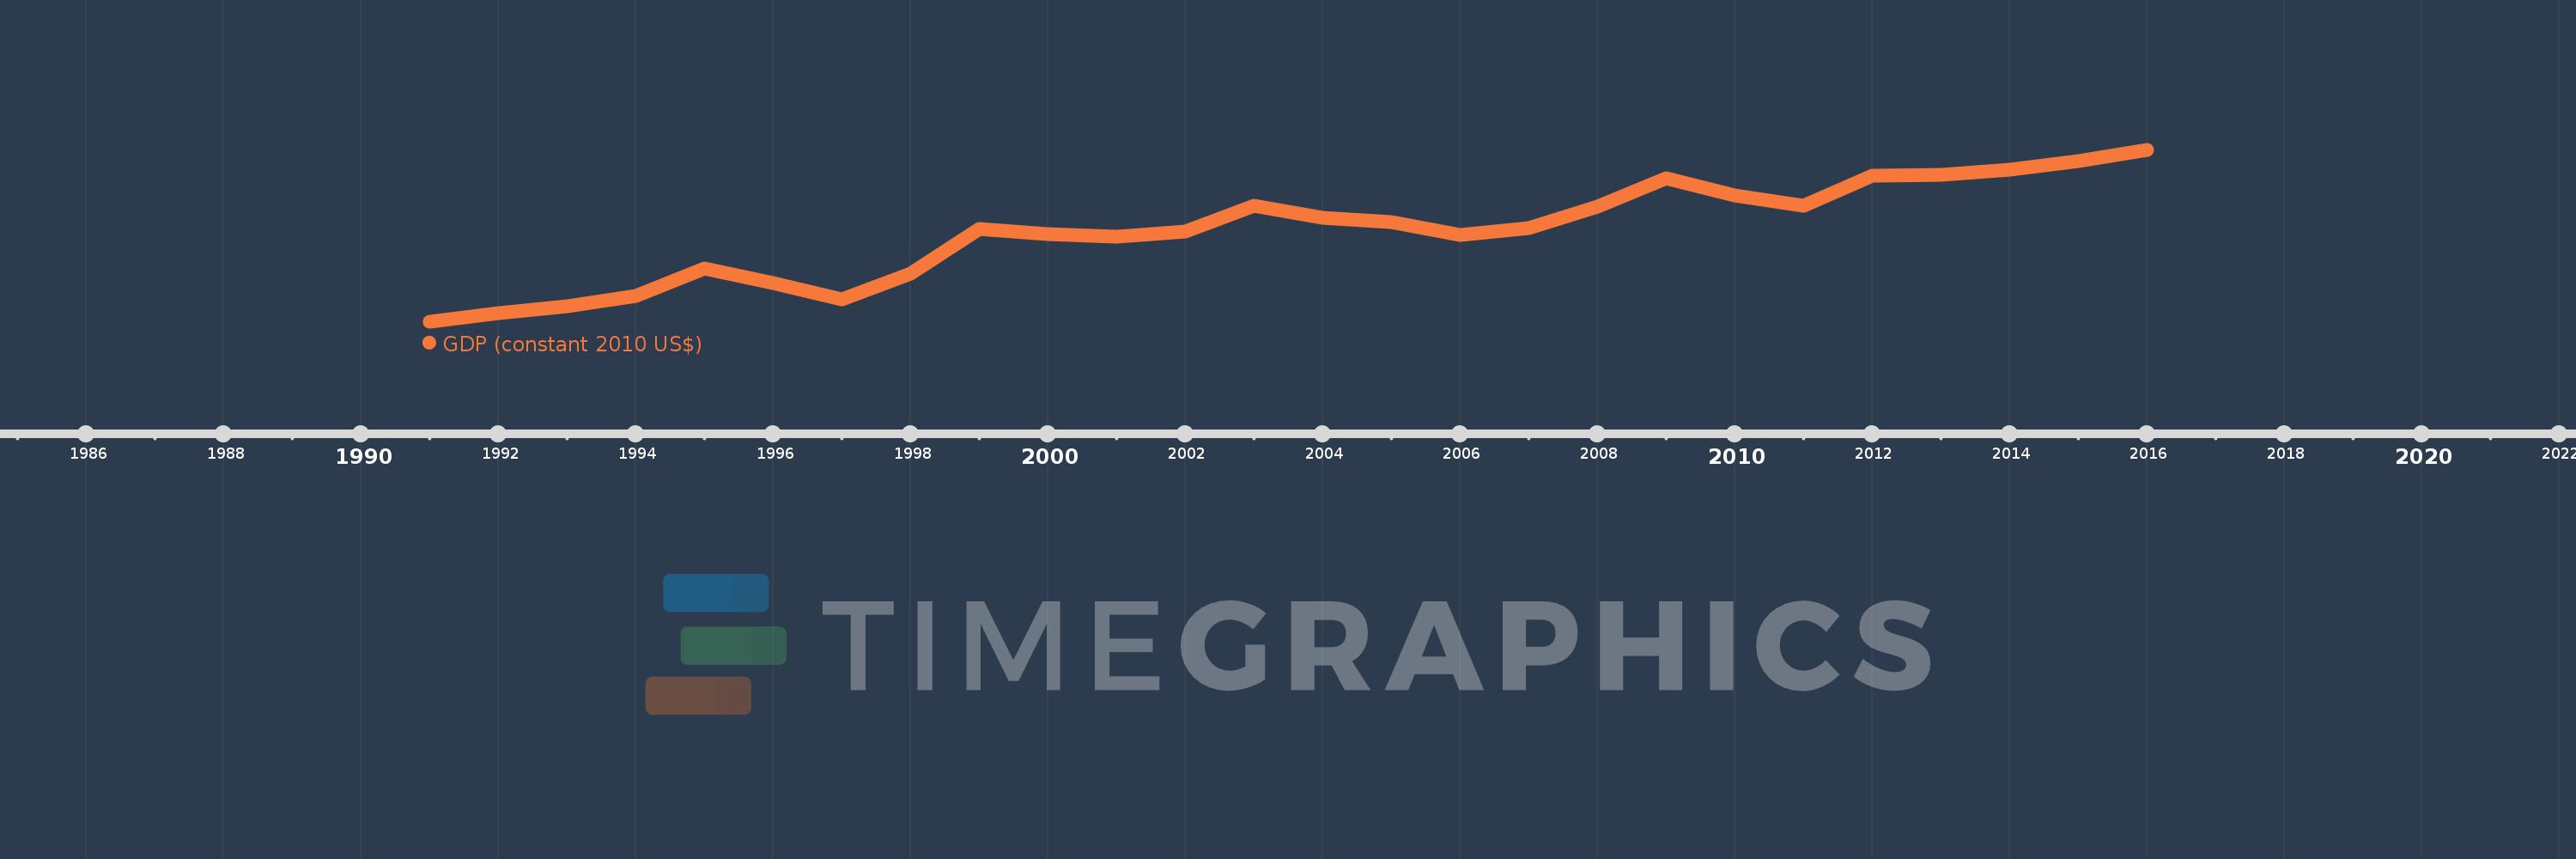
This timeline shows a graph from 1991 to 2016 of Tuvalu. No data until 1990. Number of actual observations by date: 26.
Source name:
World Development Indicators
Source organization:
World Bank national accounts data, and OECD National Accounts data files.
Categories, topics:
Economy & Growth
Last updated:
apr 23, 2017
Indicators value changes by year
Minimum:
21.442 mln
jan 1, 1991
Maximum:
36.752 mln
jan 1, 2016
At the date of observation
Value
Absolute change
Change from previous value
jan 1, 1991
21.442 mln
+21.442 mln
0.0%
jan 1, 1992
22.216 mln
+773.876K
3.61%
jan 1, 1993
22.835 mln
+619.57K
2.79%
jan 1, 1994
23.774 mln
+938.693K
4.11%
jan 1, 1995
26.219 mln
+2.445 mln
10.28%
jan 1, 1996
24.907 mln
-1.312 mln
-5.0%
jan 1, 1997
23.422 mln
-1.485 mln
-5.96%
jan 1, 1998
25.765 mln
+2.343 mln
10.0%
jan 1, 1999
29.759 mln
+3.994 mln
15.5%
jan 1, 2000
29.293 mln
-465.367K
-1.56%
jan 1, 2001
29.009 mln
-284.323K
-0.97%
jan 1, 2002
29.483 mln
+474.041K
1.63%
jan 1, 2003
31.808 mln
+2.325 mln
7.89%
jan 1, 2004
30.748 mln
-1.06 mln
-3.33%
jan 1, 2005
30.332 mln
-415.768K
-1.35%
jan 1, 2006
29.186 mln
-1.146 mln
-3.78%
jan 1, 2007
29.81 mln
+624.265K
2.14%
jan 1, 2008
31.703 mln
+1.893 mln
6.35%
jan 1, 2009
34.234 mln
+2.531 mln
7.98%
jan 1, 2010
32.716 mln
-1.518 mln
-4.43%
jan 1, 2011
31.824 mln
-892.973K
-2.73%
jan 1, 2012
34.514 mln
+2.69 mln
8.45%
jan 1, 2013
34.574 mln
+60.212K
0.17%
jan 1, 2014
35.023 mln
+448.834K
1.3%
jan 1, 2015
35.806 mln
+783.061K
2.24%
jan 1, 2016
36.752 mln
+946.041K
2.64%
Ranking of countries by current statistics by years


Comments: