29
/
en
AIzaSyAYiBZKx7MnpbEhh9jyipgxe19OcubqV5w
April 1, 2024
158442
Iraq
IRQ
true
2
1
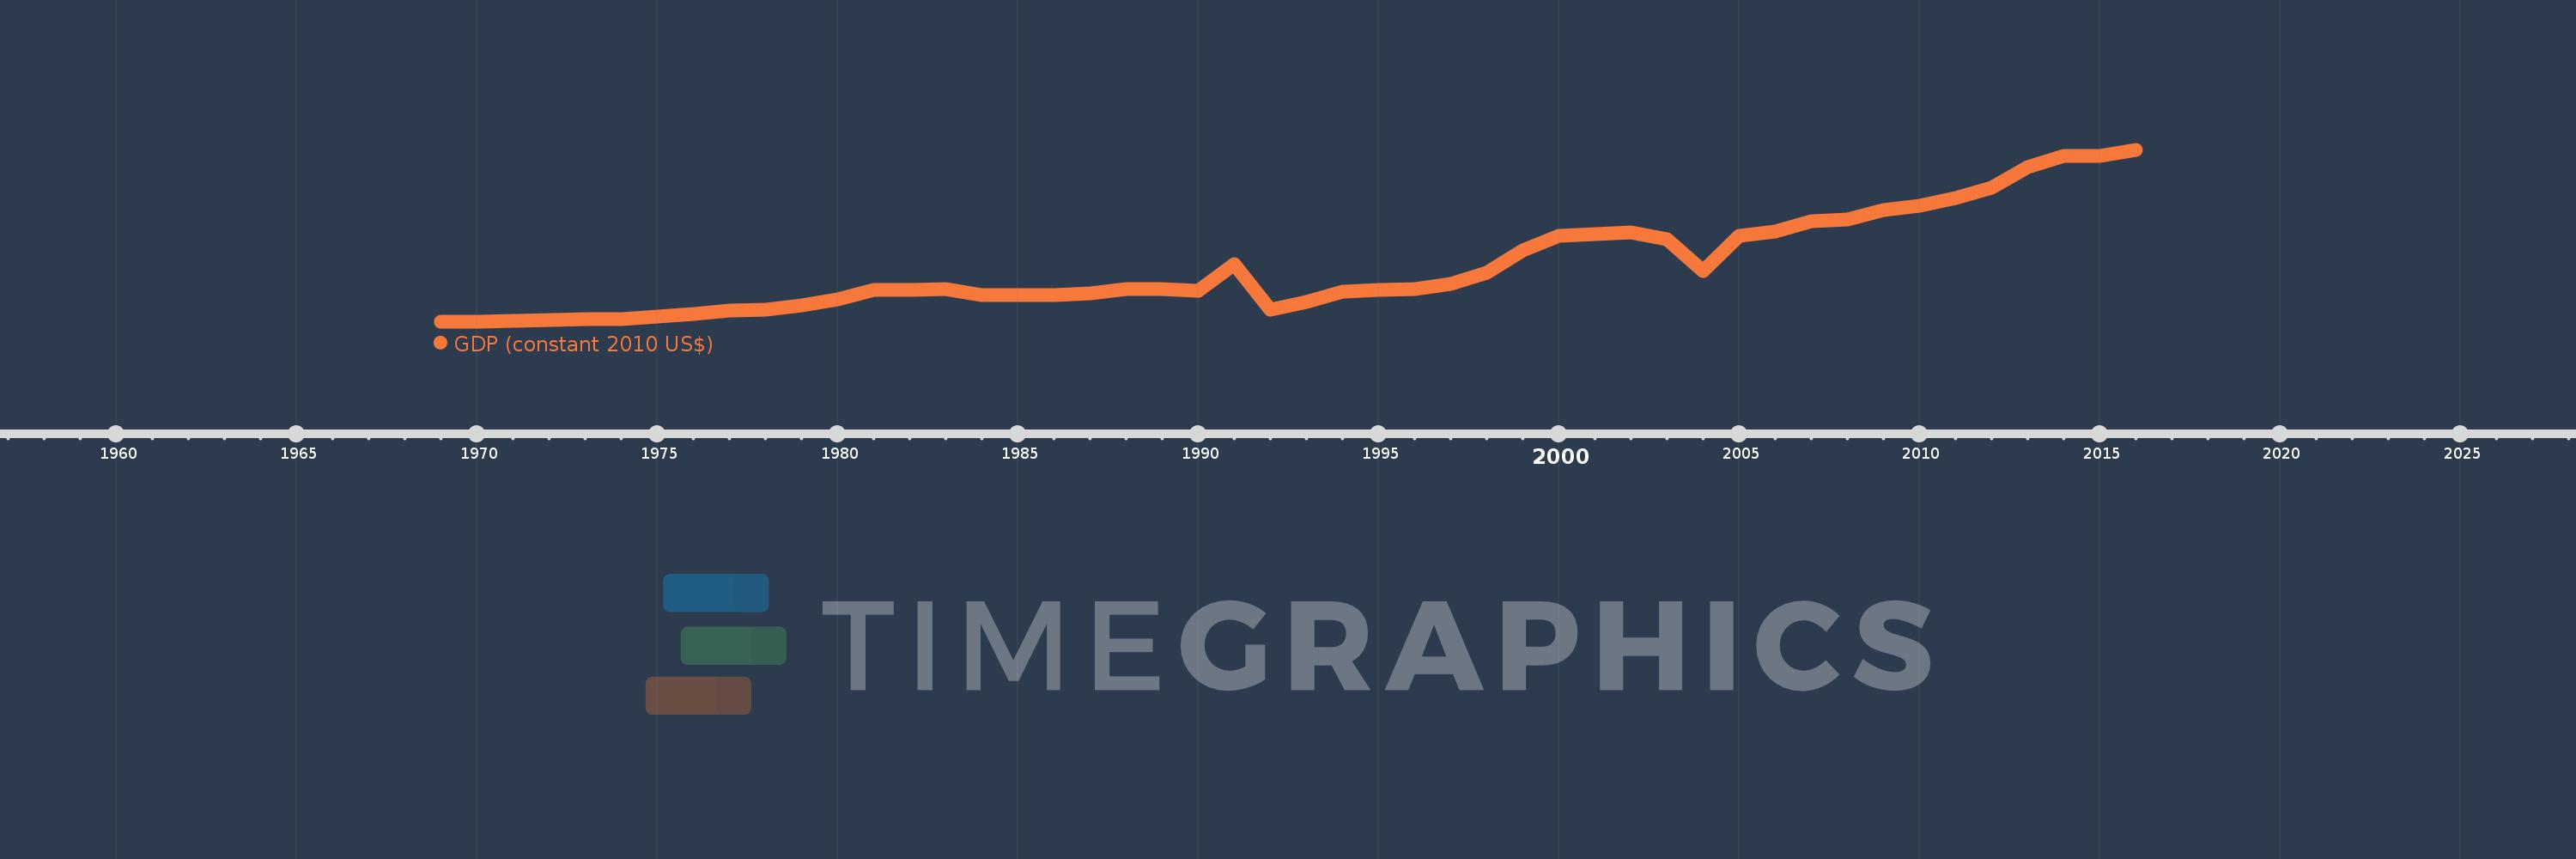
GDP (constant 2010 US$)
2016,2015,2014,2013,2012,2011,2010,2009,2008,2007,2006,2005,2004,2003,2002,2001,2000,1999,1998,1997,1996,1995,1994,1993,1992,1991,1990,1989,1988,1987,1986,1985,1984,1983,1982,1981,1980,1979,1978,1977,1976,1975,1974,1973,1972,1971,1970,1969
This statistics in other country:
AfghanistanAlbaniaAlgeriaAndorraAngolaAntigua and BarbudaArab WorldArgentinaArmeniaArubaAustraliaAustriaAzerbaijanBahamas, TheBahrainBangladeshBarbadosBelarusBelgiumBelizeBeninBermudaBhutanBoliviaBosnia and HerzegovinaBotswanaBrazilBrunei DarussalamBulgariaBurkina FasoBurundiCabo VerdeCambodiaCameroonCanadaCaribbean small statesCentral African RepublicCentral Europe and the BalticsChadChileChinaColombiaComorosCongo, Dem. Rep.Congo, Rep.Costa RicaCote d'IvoireCroatiaCubaCyprusCzech RepublicDenmarkDjiboutiDominicaDominican RepublicEarly-demographic dividendEast Asia & PacificEast Asia & Pacific (excluding high income)East Asia & Pacific (IDA & IBRD countries)EcuadorEgypt, Arab Rep.El SalvadorEquatorial GuineaEritreaEstoniaEthiopiaEuro areaEurope & Central AsiaEurope & Central Asia (excluding high income)Europe & Central Asia (IDA & IBRD countries)European UnionFaroe IslandsFijiFinlandFragile and conflict affected situationsFranceGabonGambia, TheGeorgiaGermanyGhanaGreeceGreenlandGrenadaGuatemalaGuineaGuinea-BissauGuyanaHaitiHeavily indebted poor countries (HIPC)High incomeHondurasHong Kong SAR, ChinaHungaryIBRD onlyIcelandIDA & IBRD totalIDA blendIDA onlyIDA totalIndiaIndonesiaIran, Islamic Rep.IraqIrelandIsle of ManIsraelItalyJamaicaJapanJordanKazakhstanKenyaKiribatiKorea, Rep.KosovoKuwaitKyrgyz RepublicLao PDRLate-demographic dividendLatin America & Caribbean Latin America & Caribbean (excluding high income)Latin America & the Caribbean (IDA & IBRD countries)LatviaLeast developed countries: UN classificationLebanonLesothoLiberiaLibyaLiechtensteinLithuaniaLow & middle incomeLow incomeLower middle incomeLuxembourgMacao SAR, ChinaMacedonia, FYRMadagascarMalawiMalaysiaMaldivesMaliMaltaMarshall IslandsMauritaniaMauritiusMexicoMicronesia, Fed. Sts.Middle East & North AfricaMiddle East & North Africa (excluding high income)Middle East & North Africa (IDA & IBRD countries)Middle incomeMoldovaMonacoMongoliaMontenegroMoroccoMozambiqueMyanmarNamibiaNauruNepalNetherlandsNew ZealandNicaraguaNigerNigeriaNorth AmericaNorwayOECD membersOmanOther small statesPacific island small statesPakistanPalauPanamaPapua New GuineaParaguayPeruPhilippinesPolandPortugalPost-demographic dividendPre-demographic dividendPuerto RicoQatarRomaniaRussian FederationRwandaSamoaSao Tome and PrincipeSaudi ArabiaSenegalSerbiaSeychellesSierra LeoneSingaporeSlovak RepublicSloveniaSmall statesSolomon IslandsSouth AfricaSouth AsiaSouth Asia (IDA & IBRD)South SudanSpainSri LankaSt. Kitts and NevisSt. LuciaSt. Vincent and the GrenadinesSub-Saharan Africa Sub-Saharan Africa (excluding high income)Sub-Saharan Africa (IDA & IBRD countries)SudanSurinameSwazilandSwedenSwitzerlandTajikistanTanzaniaThailandTimor-LesteTogoTongaTrinidad and TobagoTunisiaTurkeyTurkmenistanTuvaluUgandaUkraineUnited Arab EmiratesUnited KingdomUnited StatesUpper middle incomeUruguayUzbekistanVanuatuVenezuela, RBVietnamWest Bank and GazaWorldYemen, Rep.ZambiaZimbabwe Timeline:
This timeline shows a graph from 1969 to 2016 of Iraq. No data until 1968. Number of actual observations by date: 48.
Source name:
World Development Indicators
Source organization:
World Bank national accounts data, and OECD National Accounts data files.
Categories, topics:
Economy & Growth
Last updated:
apr 23, 2017
Indicators value changes by year
Minimum:
13.47 bln
jan 1, 1969
Maximum:
186.461 bln
jan 1, 2016
At the date of observation
Value
Absolute change
Change from previous value
jan 1, 1969
13.47 bln
+13.47 bln
0.0%
jan 1, 1970
13.907 bln
+437.007 mln
3.24%
jan 1, 1971
14.539 bln
+632.005 mln
4.54%
jan 1, 1972
15.321 bln
+781.431 mln
5.37%
jan 1, 1973
15.893 bln
+572.282 mln
3.74%
jan 1, 1974
16.595 bln
+702.281 mln
4.42%
jan 1, 1975
19.27 bln
+2.674 bln
16.11%
jan 1, 1976
21.676 bln
+2.407 bln
12.49%
jan 1, 1977
25.399 bln
+3.723 bln
17.18%
jan 1, 1978
25.882 bln
+482.578 mln
1.9%
jan 1, 1979
30.297 bln
+4.415 bln
17.06%
jan 1, 1980
36.619 bln
+6.323 bln
20.87%
jan 1, 1981
45.684 bln
+9.065 bln
24.75%
jan 1, 1982
45.351 bln
-332.912 mln
-0.73%
jan 1, 1983
46.908 bln
+1.557 bln
3.43%
jan 1, 1984
40.776 bln
-6.132 bln
-13.07%
jan 1, 1985
40.17 bln
-605.621 mln
-1.49%
jan 1, 1986
40.754 bln
+584.035 mln
1.45%
jan 1, 1987
42.648 bln
+1.894 bln
4.65%
jan 1, 1988
46.617 bln
+3.969 bln
9.31%
jan 1, 1989
46.608 bln
-8.874 mln
-0.02%
jan 1, 1990
45.155 bln
-1.453 bln
-3.12%
jan 1, 1991
71.262 bln
+26.107 bln
57.82%
jan 1, 1992
25.621 bln
-45.641 bln
-64.05%
jan 1, 1993
33.971 bln
+8.35 bln
32.59%
jan 1, 1994
44.261 bln
+10.29 bln
30.29%
jan 1, 1995
45.967 bln
+1.706 bln
3.85%
jan 1, 1996
46.942 bln
+974.511 mln
2.12%
jan 1, 1997
52.115 bln
+5.173 bln
11.02%
jan 1, 1998
63.183 bln
+11.068 bln
21.24%
jan 1, 1999
85.207 bln
+22.024 bln
34.86%
jan 1, 2000
100.188 bln
+14.981 bln
17.58%
jan 1, 2001
101.597 bln
+1.409 bln
1.41%
jan 1, 2002
103.939 bln
+2.342 bln
2.31%
jan 1, 2003
96.767 bln
-7.172 bln
-6.9%
jan 1, 2004
64.736 bln
-32.031 bln
-33.1%
jan 1, 2005
99.796 bln
+35.06 bln
54.16%
jan 1, 2006
104.188 bln
+4.392 bln
4.4%
jan 1, 2007
114.772 bln
+10.584 bln
10.16%
jan 1, 2008
116.353 bln
+1.581 bln
1.38%
jan 1, 2009
125.926 bln
+9.574 bln
8.23%
jan 1, 2010
130.182 bln
+4.255 bln
3.38%
jan 1, 2011
138.517 bln
+8.335 bln
6.4%
jan 1, 2012
148.97 bln
+10.453 bln
7.55%
jan 1, 2013
169.731 bln
+20.761 bln
13.94%
jan 1, 2014
180.886 bln
+11.155 bln
6.57%
jan 1, 2015
180.995 bln
+108.728 mln
0.06%
jan 1, 2016
186.461 bln
+5.466 bln
3.02%
Ranking of countries by current statistics by years


Comments: