29
/
en
AIzaSyAYiBZKx7MnpbEhh9jyipgxe19OcubqV5w
April 1, 2024
182925
Macao SAR, China
MAC
true
2
1
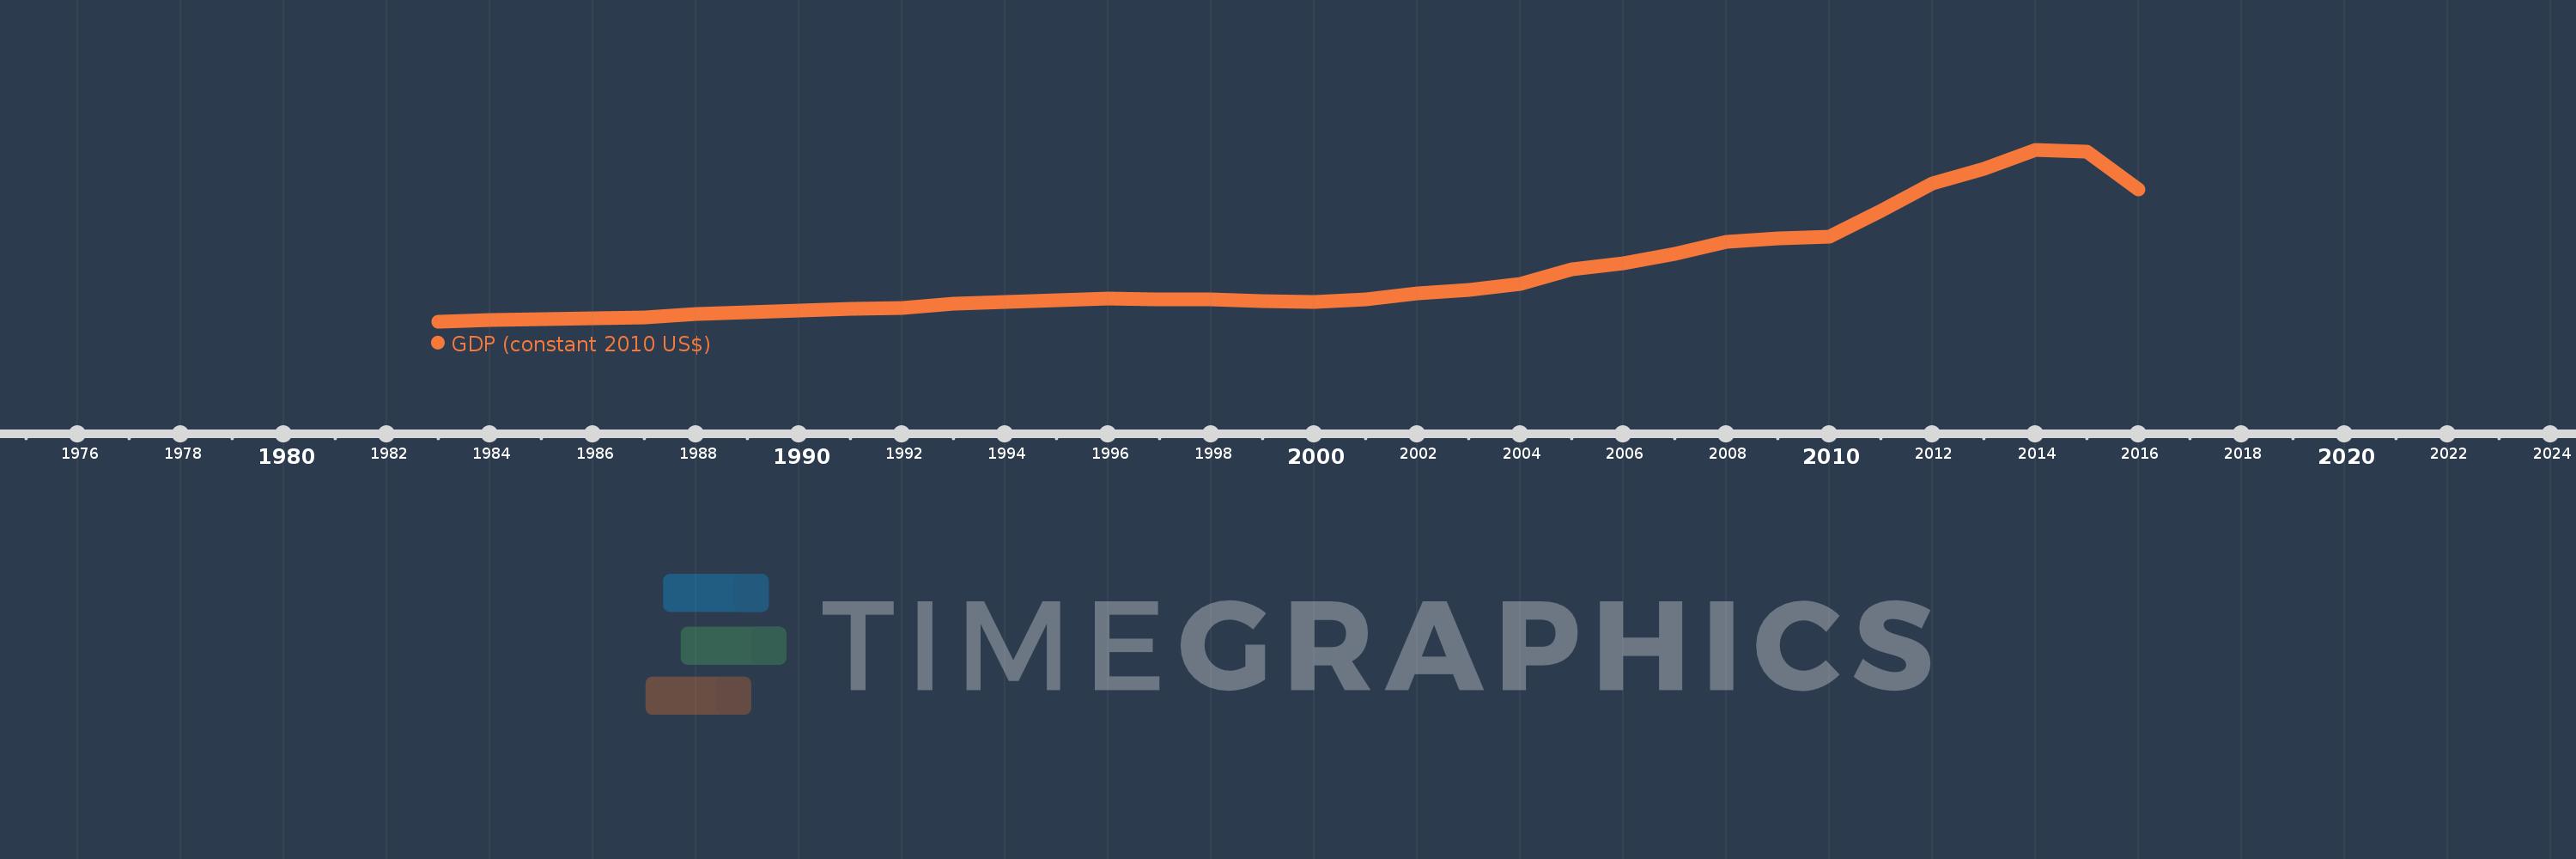
GDP (constant 2010 US$)
2016,2015,2014,2013,2012,2011,2010,2009,2008,2007,2006,2005,2004,2003,2002,2001,2000,1999,1998,1997,1996,1995,1994,1993,1992,1991,1990,1989,1988,1987,1986,1985,1984,1983
This statistics in other country:
AfghanistanAlbaniaAlgeriaAndorraAngolaAntigua and BarbudaArab WorldArgentinaArmeniaArubaAustraliaAustriaAzerbaijanBahamas, TheBahrainBangladeshBarbadosBelarusBelgiumBelizeBeninBermudaBhutanBoliviaBosnia and HerzegovinaBotswanaBrazilBrunei DarussalamBulgariaBurkina FasoBurundiCabo VerdeCambodiaCameroonCanadaCaribbean small statesCentral African RepublicCentral Europe and the BalticsChadChileChinaColombiaComorosCongo, Dem. Rep.Congo, Rep.Costa RicaCote d'IvoireCroatiaCubaCyprusCzech RepublicDenmarkDjiboutiDominicaDominican RepublicEarly-demographic dividendEast Asia & PacificEast Asia & Pacific (excluding high income)East Asia & Pacific (IDA & IBRD countries)EcuadorEgypt, Arab Rep.El SalvadorEquatorial GuineaEritreaEstoniaEthiopiaEuro areaEurope & Central AsiaEurope & Central Asia (excluding high income)Europe & Central Asia (IDA & IBRD countries)European UnionFaroe IslandsFijiFinlandFragile and conflict affected situationsFranceGabonGambia, TheGeorgiaGermanyGhanaGreeceGreenlandGrenadaGuatemalaGuineaGuinea-BissauGuyanaHaitiHeavily indebted poor countries (HIPC)High incomeHondurasHong Kong SAR, ChinaHungaryIBRD onlyIcelandIDA & IBRD totalIDA blendIDA onlyIDA totalIndiaIndonesiaIran, Islamic Rep.IraqIrelandIsle of ManIsraelItalyJamaicaJapanJordanKazakhstanKenyaKiribatiKorea, Rep.KosovoKuwaitKyrgyz RepublicLao PDRLate-demographic dividendLatin America & Caribbean Latin America & Caribbean (excluding high income)Latin America & the Caribbean (IDA & IBRD countries)LatviaLeast developed countries: UN classificationLebanonLesothoLiberiaLibyaLiechtensteinLithuaniaLow & middle incomeLow incomeLower middle incomeLuxembourgMacao SAR, ChinaMacedonia, FYRMadagascarMalawiMalaysiaMaldivesMaliMaltaMarshall IslandsMauritaniaMauritiusMexicoMicronesia, Fed. Sts.Middle East & North AfricaMiddle East & North Africa (excluding high income)Middle East & North Africa (IDA & IBRD countries)Middle incomeMoldovaMonacoMongoliaMontenegroMoroccoMozambiqueMyanmarNamibiaNauruNepalNetherlandsNew ZealandNicaraguaNigerNigeriaNorth AmericaNorwayOECD membersOmanOther small statesPacific island small statesPakistanPalauPanamaPapua New GuineaParaguayPeruPhilippinesPolandPortugalPost-demographic dividendPre-demographic dividendPuerto RicoQatarRomaniaRussian FederationRwandaSamoaSao Tome and PrincipeSaudi ArabiaSenegalSerbiaSeychellesSierra LeoneSingaporeSlovak RepublicSloveniaSmall statesSolomon IslandsSouth AfricaSouth AsiaSouth Asia (IDA & IBRD)South SudanSpainSri LankaSt. Kitts and NevisSt. LuciaSt. Vincent and the GrenadinesSub-Saharan Africa Sub-Saharan Africa (excluding high income)Sub-Saharan Africa (IDA & IBRD countries)SudanSurinameSwazilandSwedenSwitzerlandTajikistanTanzaniaThailandTimor-LesteTogoTongaTrinidad and TobagoTunisiaTurkeyTurkmenistanTuvaluUgandaUkraineUnited Arab EmiratesUnited KingdomUnited StatesUpper middle incomeUruguayUzbekistanVanuatuVenezuela, RBVietnamWest Bank and GazaWorldYemen, Rep.ZambiaZimbabwe Timeline:
This timeline shows a graph from 1983 to 2016 of Macao SAR, China. No data until 1982. Number of actual observations by date: 34.
Source name:
World Development Indicators
Source organization:
World Bank national accounts data, and OECD National Accounts data files.
Categories, topics:
Economy & Growth
Last updated:
apr 23, 2017
Indicators value changes by year
Minimum:
3.683 bln
jan 1, 1983
Maximum:
41.564 bln
jan 1, 2014
At the date of observation
Value
Absolute change
Change from previous value
jan 1, 1983
3.683 bln
+3.683 bln
0.0%
jan 1, 1984
4.052 bln
+368.323 mln
10.0%
jan 1, 1985
4.396 bln
+344.382 mln
8.5%
jan 1, 1986
4.427 bln
+30.772 mln
0.7%
jan 1, 1987
4.723 bln
+296.589 mln
6.7%
jan 1, 1988
5.399 bln
+675.432 mln
14.3%
jan 1, 1989
5.82 bln
+421.101 mln
7.8%
jan 1, 1990
6.111 bln
+290.992 mln
5.0%
jan 1, 1991
6.6 bln
+488.866 mln
8.0%
jan 1, 1992
6.844 bln
+244.188 mln
3.7%
jan 1, 1993
7.754 bln
+910.236 mln
13.3%
jan 1, 1994
8.157 bln
+403.214 mln
5.2%
jan 1, 1995
8.508 bln
+350.765 mln
4.3%
jan 1, 1996
8.789 bln
+280.767 mln
3.3%
jan 1, 1997
8.754 bln
-35.155 mln
-0.4%
jan 1, 1998
8.727 bln
-26.261 mln
-0.3%
jan 1, 1999
8.326 bln
-401.462 mln
-4.6%
jan 1, 2000
8.126 bln
-199.824 mln
-2.4%
jan 1, 2001
8.589 bln
+463.191 mln
5.7%
jan 1, 2002
9.918 bln
+1.329 bln
15.47%
jan 1, 2003
10.806 bln
+887.424 mln
8.95%
jan 1, 2004
12.065 bln
+1.259 bln
11.65%
jan 1, 2005
15.293 bln
+3.228 bln
26.75%
jan 1, 2006
16.526 bln
+1.233 bln
8.06%
jan 1, 2007
18.726 bln
+2.2 bln
13.31%
jan 1, 2008
21.431 bln
+2.705 bln
14.45%
jan 1, 2009
22.159 bln
+727.332 mln
3.39%
jan 1, 2010
22.452 bln
+292.743 mln
1.32%
jan 1, 2011
28.124 bln
+5.672 bln
25.26%
jan 1, 2012
34.219 bln
+6.095 bln
21.67%
jan 1, 2013
37.377 bln
+3.158 bln
9.23%
jan 1, 2014
41.564 bln
+4.186 bln
11.2%
jan 1, 2015
41.209 bln
-354.164 mln
-0.85%
jan 1, 2016
32.824 bln
-8.386 bln
-20.35%
Ranking of countries by current statistics by years


Comments: