29
/
en
AIzaSyAYiBZKx7MnpbEhh9jyipgxe19OcubqV5w
April 1, 2024
126172
El Salvador
SLV
true
2
1
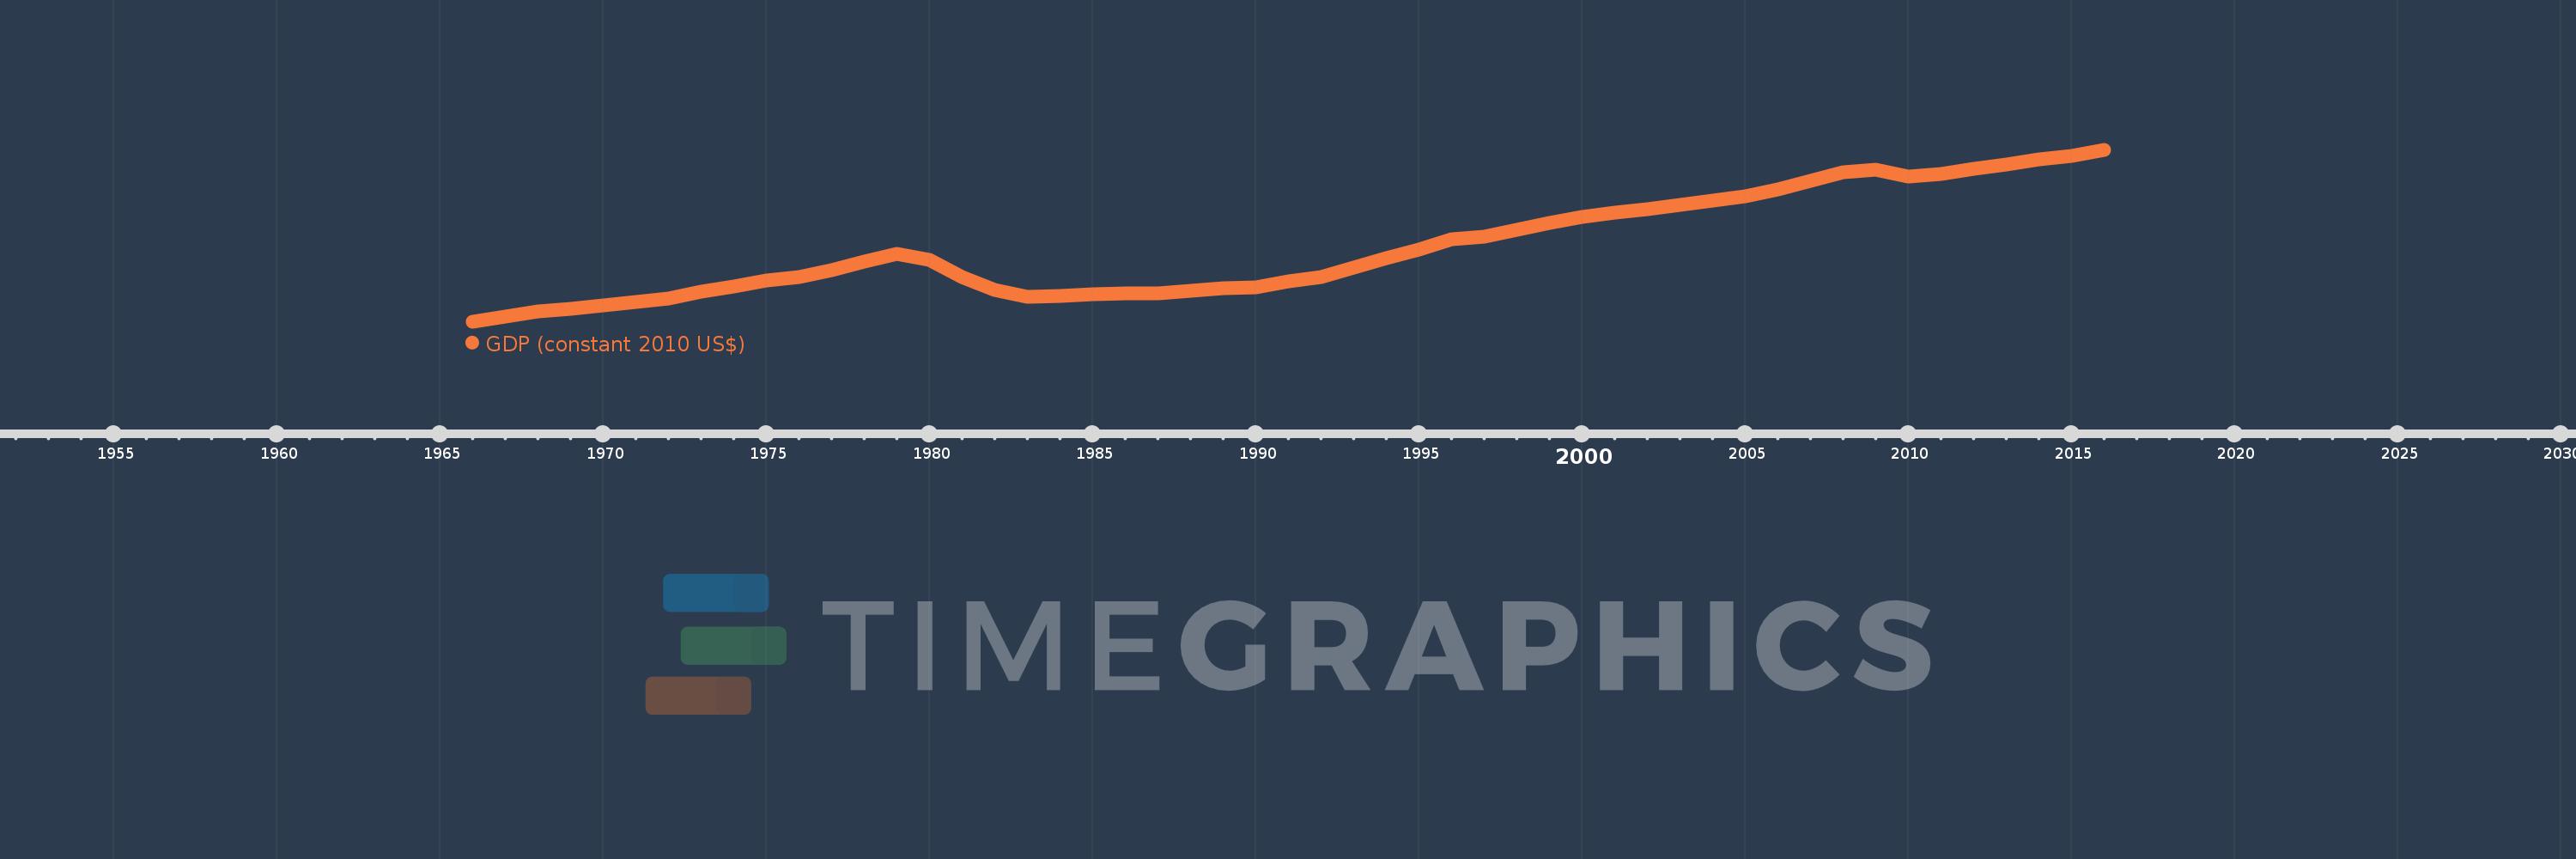
GDP (constant 2010 US$)
2016,2015,2014,2013,2012,2011,2010,2009,2008,2007,2006,2005,2004,2003,2002,2001,2000,1999,1998,1997,1996,1995,1994,1993,1992,1991,1990,1989,1988,1987,1986,1985,1984,1983,1982,1981,1980,1979,1978,1977,1976,1975,1974,1973,1972,1971,1970,1969,1968,1967,1966
This statistics in other country:
AfghanistanAlbaniaAlgeriaAndorraAngolaAntigua and BarbudaArab WorldArgentinaArmeniaArubaAustraliaAustriaAzerbaijanBahamas, TheBahrainBangladeshBarbadosBelarusBelgiumBelizeBeninBermudaBhutanBoliviaBosnia and HerzegovinaBotswanaBrazilBrunei DarussalamBulgariaBurkina FasoBurundiCabo VerdeCambodiaCameroonCanadaCaribbean small statesCentral African RepublicCentral Europe and the BalticsChadChileChinaColombiaComorosCongo, Dem. Rep.Congo, Rep.Costa RicaCote d'IvoireCroatiaCubaCyprusCzech RepublicDenmarkDjiboutiDominicaDominican RepublicEarly-demographic dividendEast Asia & PacificEast Asia & Pacific (excluding high income)East Asia & Pacific (IDA & IBRD countries)EcuadorEgypt, Arab Rep.El SalvadorEquatorial GuineaEritreaEstoniaEthiopiaEuro areaEurope & Central AsiaEurope & Central Asia (excluding high income)Europe & Central Asia (IDA & IBRD countries)European UnionFaroe IslandsFijiFinlandFragile and conflict affected situationsFranceGabonGambia, TheGeorgiaGermanyGhanaGreeceGreenlandGrenadaGuatemalaGuineaGuinea-BissauGuyanaHaitiHeavily indebted poor countries (HIPC)High incomeHondurasHong Kong SAR, ChinaHungaryIBRD onlyIcelandIDA & IBRD totalIDA blendIDA onlyIDA totalIndiaIndonesiaIran, Islamic Rep.IraqIrelandIsle of ManIsraelItalyJamaicaJapanJordanKazakhstanKenyaKiribatiKorea, Rep.KosovoKuwaitKyrgyz RepublicLao PDRLate-demographic dividendLatin America & Caribbean Latin America & Caribbean (excluding high income)Latin America & the Caribbean (IDA & IBRD countries)LatviaLeast developed countries: UN classificationLebanonLesothoLiberiaLibyaLiechtensteinLithuaniaLow & middle incomeLow incomeLower middle incomeLuxembourgMacao SAR, ChinaMacedonia, FYRMadagascarMalawiMalaysiaMaldivesMaliMaltaMarshall IslandsMauritaniaMauritiusMexicoMicronesia, Fed. Sts.Middle East & North AfricaMiddle East & North Africa (excluding high income)Middle East & North Africa (IDA & IBRD countries)Middle incomeMoldovaMonacoMongoliaMontenegroMoroccoMozambiqueMyanmarNamibiaNauruNepalNetherlandsNew ZealandNicaraguaNigerNigeriaNorth AmericaNorwayOECD membersOmanOther small statesPacific island small statesPakistanPalauPanamaPapua New GuineaParaguayPeruPhilippinesPolandPortugalPost-demographic dividendPre-demographic dividendPuerto RicoQatarRomaniaRussian FederationRwandaSamoaSao Tome and PrincipeSaudi ArabiaSenegalSerbiaSeychellesSierra LeoneSingaporeSlovak RepublicSloveniaSmall statesSolomon IslandsSouth AfricaSouth AsiaSouth Asia (IDA & IBRD)South SudanSpainSri LankaSt. Kitts and NevisSt. LuciaSt. Vincent and the GrenadinesSub-Saharan Africa Sub-Saharan Africa (excluding high income)Sub-Saharan Africa (IDA & IBRD countries)SudanSurinameSwazilandSwedenSwitzerlandTajikistanTanzaniaThailandTimor-LesteTogoTongaTrinidad and TobagoTunisiaTurkeyTurkmenistanTuvaluUgandaUkraineUnited Arab EmiratesUnited KingdomUnited StatesUpper middle incomeUruguayUzbekistanVanuatuVenezuela, RBVietnamWest Bank and GazaWorldYemen, Rep.ZambiaZimbabwe Timeline:
This timeline shows a graph from 1966 to 2016 of El Salvador. No data until 1965. Number of actual observations by date: 51.
Source name:
World Development Indicators
Source organization:
World Bank national accounts data, and OECD National Accounts data files.
Categories, topics:
Economy & Growth
Last updated:
apr 23, 2017
Indicators value changes by year
Minimum:
7.571 bln
jan 1, 1966
Maximum:
23.606 bln
jan 1, 2016
At the date of observation
Value
Absolute change
Change from previous value
jan 1, 1966
7.571 bln
+7.571 bln
0.0%
jan 1, 1967
8.113 bln
+542.182 mln
7.16%
jan 1, 1968
8.554 bln
+441.111 mln
5.44%
jan 1, 1969
8.831 bln
+276.882 mln
3.24%
jan 1, 1970
9.139 bln
+307.809 mln
3.49%
jan 1, 1971
9.411 bln
+272.099 mln
2.98%
jan 1, 1972
9.774 bln
+363.11 mln
3.86%
jan 1, 1973
10.372 bln
+597.95 mln
6.12%
jan 1, 1974
10.877 bln
+504.268 mln
4.86%
jan 1, 1975
11.457 bln
+580.374 mln
5.34%
jan 1, 1976
11.792 bln
+334.948 mln
2.92%
jan 1, 1977
12.387 bln
+595.404 mln
5.05%
jan 1, 1978
13.227 bln
+839.867 mln
6.78%
jan 1, 1979
13.931 bln
+704.051 mln
5.32%
jan 1, 1980
13.349 bln
-582.362 mln
-4.18%
jan 1, 1981
11.778 bln
-1.571 bln
-11.77%
jan 1, 1982
10.547 bln
-1.231 bln
-10.45%
jan 1, 1983
9.882 bln
-665.051 mln
-6.31%
jan 1, 1984
10.033 bln
+151.684 mln
1.54%
jan 1, 1985
10.167 bln
+134.141 mln
1.34%
jan 1, 1986
10.23 bln
+62.692 mln
0.62%
jan 1, 1987
10.25 bln
+19.375 mln
0.19%
jan 1, 1988
10.507 bln
+257.63 mln
2.51%
jan 1, 1989
10.704 bln
+197.267 mln
1.88%
jan 1, 1990
10.807 bln
+102.997 mln
0.96%
jan 1, 1991
11.33 bln
+522.166 mln
4.83%
jan 1, 1992
11.735 bln
+405.192 mln
3.58%
jan 1, 1993
12.62 bln
+885.192 mln
7.54%
jan 1, 1994
13.55 bln
+930.03 mln
7.37%
jan 1, 1995
14.37 bln
+819.823 mln
6.05%
jan 1, 1996
15.289 bln
+919.175 mln
6.4%
jan 1, 1997
15.55 bln
+260.767 mln
1.71%
jan 1, 1998
16.21 bln
+660.295 mln
4.25%
jan 1, 1999
16.818 bln
+607.67 mln
3.75%
jan 1, 2000
17.398 bln
+580.059 mln
3.45%
jan 1, 2001
17.772 bln
+374.513 mln
2.15%
jan 1, 2002
18.076 bln
+303.717 mln
1.71%
jan 1, 2003
18.499 bln
+423.127 mln
2.34%
jan 1, 2004
18.925 bln
+425.487 mln
2.3%
jan 1, 2005
19.275 bln
+350.207 mln
1.85%
jan 1, 2006
19.962 bln
+686.726 mln
3.56%
jan 1, 2007
20.742 bln
+780.885 mln
3.91%
jan 1, 2008
21.539 bln
+796.461 mln
3.84%
jan 1, 2009
21.813 bln
+274.454 mln
1.27%
jan 1, 2010
21.13 bln
-683.422 mln
-3.13%
jan 1, 2011
21.418 bln
+288.378 mln
1.36%
jan 1, 2012
21.893 bln
+474.809 mln
2.22%
jan 1, 2013
22.305 bln
+411.8 mln
1.88%
jan 1, 2014
22.717 bln
+412.036 mln
1.85%
jan 1, 2015
23.041 bln
+323.776 mln
1.43%
jan 1, 2016
23.606 bln
+565.664 mln
2.46%
Ranking of countries by current statistics by years


Comments: