29
/
en
AIzaSyAYiBZKx7MnpbEhh9jyipgxe19OcubqV5w
April 1, 2024
31584
Europe & Central Asia (excluding high income)
ECA
false
2
1
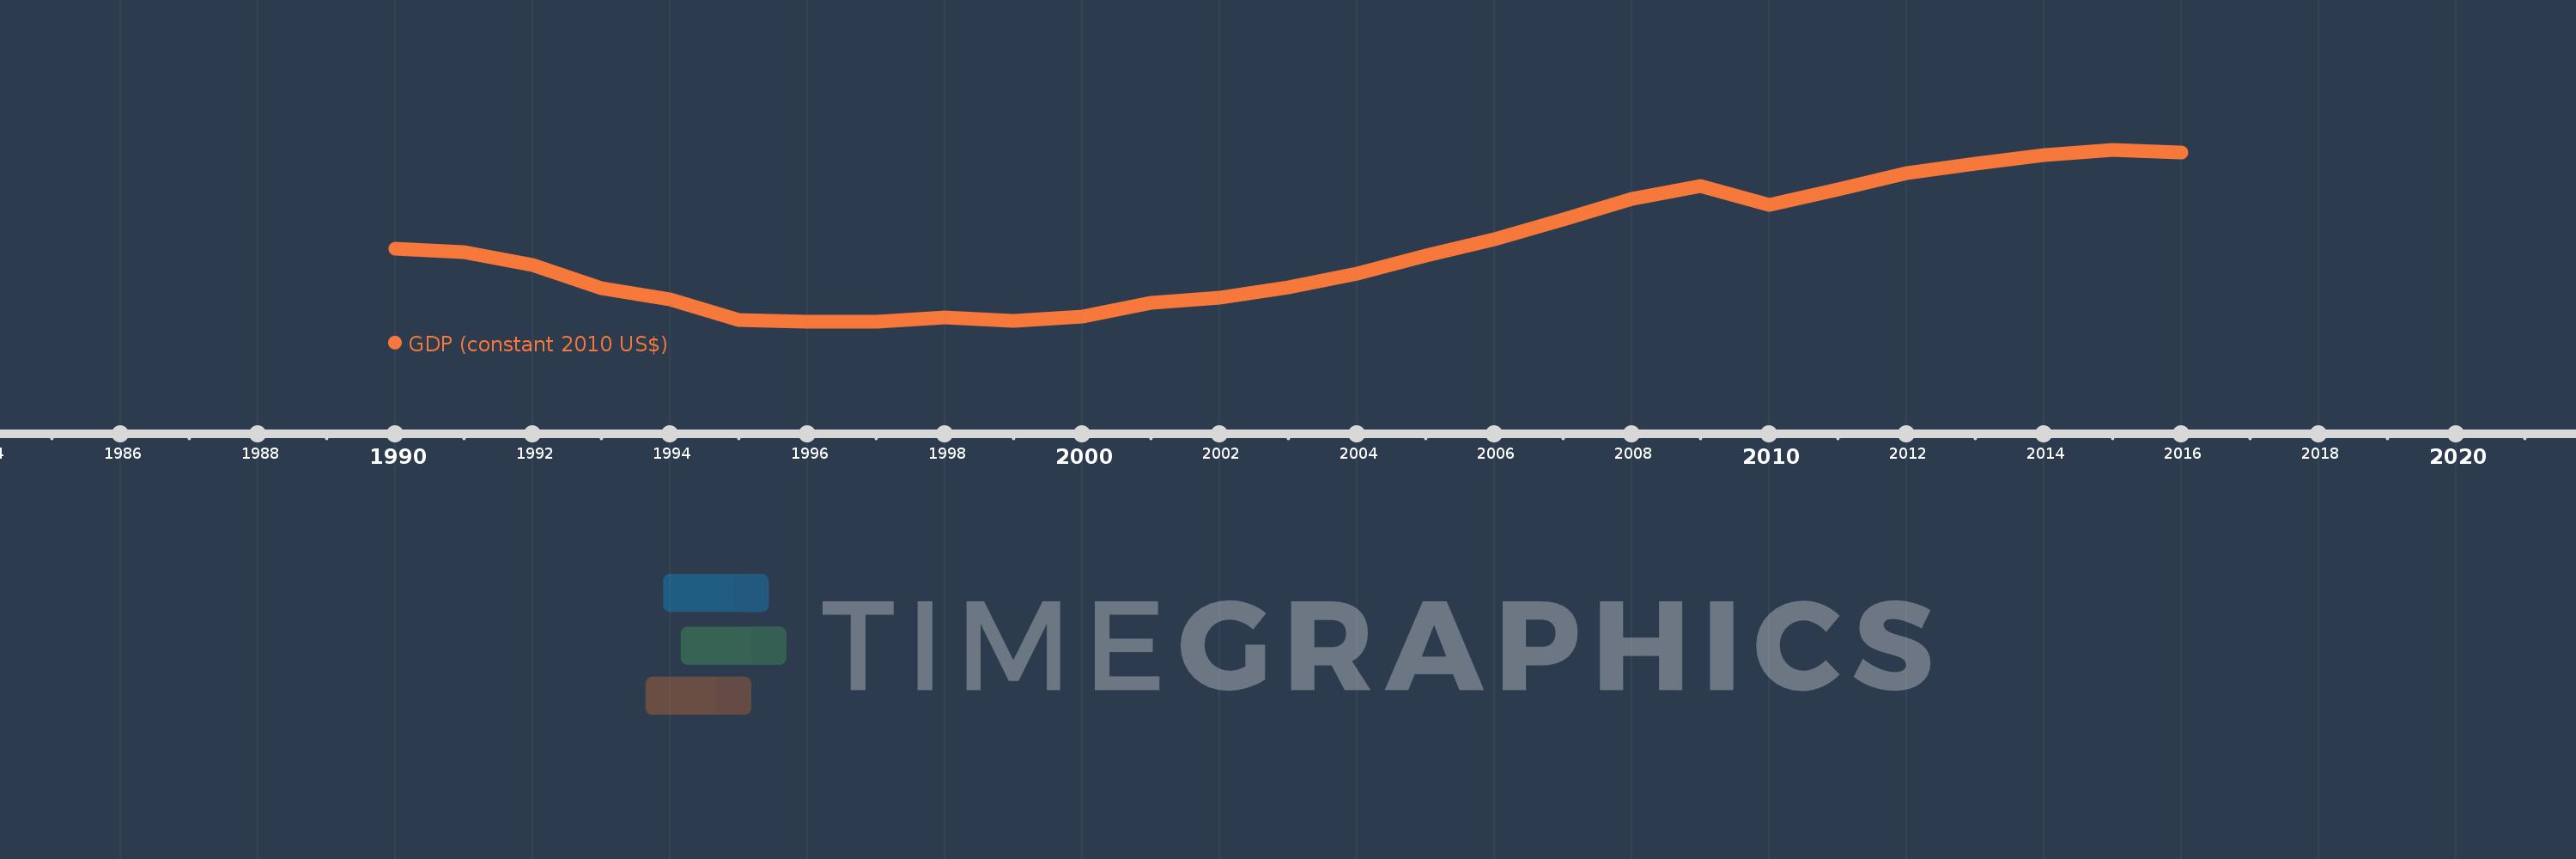
GDP (constant 2010 US$)
2016,2015,2014,2013,2012,2011,2010,2009,2008,2007,2006,2005,2004,2003,2002,2001,2000,1999,1998,1997,1996,1995,1994,1993,1992,1991,1990
This statistics in other country:
AfghanistanAlbaniaAlgeriaAndorraAngolaAntigua and BarbudaArab WorldArgentinaArmeniaArubaAustraliaAustriaAzerbaijanBahamas, TheBahrainBangladeshBarbadosBelarusBelgiumBelizeBeninBermudaBhutanBoliviaBosnia and HerzegovinaBotswanaBrazilBrunei DarussalamBulgariaBurkina FasoBurundiCabo VerdeCambodiaCameroonCanadaCaribbean small statesCentral African RepublicCentral Europe and the BalticsChadChileChinaColombiaComorosCongo, Dem. Rep.Congo, Rep.Costa RicaCote d'IvoireCroatiaCubaCyprusCzech RepublicDenmarkDjiboutiDominicaDominican RepublicEarly-demographic dividendEast Asia & PacificEast Asia & Pacific (excluding high income)East Asia & Pacific (IDA & IBRD countries)EcuadorEgypt, Arab Rep.El SalvadorEquatorial GuineaEritreaEstoniaEthiopiaEuro areaEurope & Central AsiaEurope & Central Asia (excluding high income)Europe & Central Asia (IDA & IBRD countries)European UnionFaroe IslandsFijiFinlandFragile and conflict affected situationsFranceGabonGambia, TheGeorgiaGermanyGhanaGreeceGreenlandGrenadaGuatemalaGuineaGuinea-BissauGuyanaHaitiHeavily indebted poor countries (HIPC)High incomeHondurasHong Kong SAR, ChinaHungaryIBRD onlyIcelandIDA & IBRD totalIDA blendIDA onlyIDA totalIndiaIndonesiaIran, Islamic Rep.IraqIrelandIsle of ManIsraelItalyJamaicaJapanJordanKazakhstanKenyaKiribatiKorea, Rep.KosovoKuwaitKyrgyz RepublicLao PDRLate-demographic dividendLatin America & Caribbean Latin America & Caribbean (excluding high income)Latin America & the Caribbean (IDA & IBRD countries)LatviaLeast developed countries: UN classificationLebanonLesothoLiberiaLibyaLiechtensteinLithuaniaLow & middle incomeLow incomeLower middle incomeLuxembourgMacao SAR, ChinaMacedonia, FYRMadagascarMalawiMalaysiaMaldivesMaliMaltaMarshall IslandsMauritaniaMauritiusMexicoMicronesia, Fed. Sts.Middle East & North AfricaMiddle East & North Africa (excluding high income)Middle East & North Africa (IDA & IBRD countries)Middle incomeMoldovaMonacoMongoliaMontenegroMoroccoMozambiqueMyanmarNamibiaNauruNepalNetherlandsNew ZealandNicaraguaNigerNigeriaNorth AmericaNorwayOECD membersOmanOther small statesPacific island small statesPakistanPalauPanamaPapua New GuineaParaguayPeruPhilippinesPolandPortugalPost-demographic dividendPre-demographic dividendPuerto RicoQatarRomaniaRussian FederationRwandaSamoaSao Tome and PrincipeSaudi ArabiaSenegalSerbiaSeychellesSierra LeoneSingaporeSlovak RepublicSloveniaSmall statesSolomon IslandsSouth AfricaSouth AsiaSouth Asia (IDA & IBRD)South SudanSpainSri LankaSt. Kitts and NevisSt. LuciaSt. Vincent and the GrenadinesSub-Saharan Africa Sub-Saharan Africa (excluding high income)Sub-Saharan Africa (IDA & IBRD countries)SudanSurinameSwazilandSwedenSwitzerlandTajikistanTanzaniaThailandTimor-LesteTogoTongaTrinidad and TobagoTunisiaTurkeyTurkmenistanTuvaluUgandaUkraineUnited Arab EmiratesUnited KingdomUnited StatesUpper middle incomeUruguayUzbekistanVanuatuVenezuela, RBVietnamWest Bank and GazaWorldYemen, Rep.ZambiaZimbabwe Timeline:
This timeline shows a graph from 1990 to 2016 of Europe & Central Asia (excluding high income). No data until 1989. Number of actual observations by date: 27.
Source name:
World Development Indicators
Source organization:
World Bank national accounts data, and OECD National Accounts data files.
Categories, topics:
Economy & Growth
Last updated:
apr 23, 2017
Indicators value changes by year
Minimum:
1.706 trl
jan 1, 1997
Maximum:
3.45 trl
jan 1, 2015
At the date of observation
Value
Absolute change
Change from previous value
jan 1, 1990
2.45 trl
+2.45 trl
0.0%
jan 1, 1991
2.414 trl
-36.17 bln
-1.48%
jan 1, 1992
2.287 trl
-127.285 bln
-5.27%
jan 1, 1993
2.046 trl
-240.906 bln
-10.54%
jan 1, 1994
1.931 trl
-114.367 bln
-5.59%
jan 1, 1995
1.728 trl
-202.955 bln
-10.51%
jan 1, 1996
1.706 trl
-22.565 bln
-1.31%
jan 1, 1997
1.706 trl
-214.593 mln
-0.01%
jan 1, 1998
1.751 trl
+44.924 bln
2.63%
jan 1, 1999
1.719 trl
-31.154 bln
-1.78%
jan 1, 2000
1.757 trl
+37.619 bln
2.19%
jan 1, 2001
1.899 trl
+141.706 bln
8.06%
jan 1, 2002
1.952 trl
+53.029 bln
2.79%
jan 1, 2003
2.057 trl
+105.495 bln
5.4%
jan 1, 2004
2.196 trl
+139.014 bln
6.76%
jan 1, 2005
2.376 trl
+179.979 bln
8.19%
jan 1, 2006
2.542 trl
+165.48 bln
6.96%
jan 1, 2007
2.747 trl
+205.611 bln
8.09%
jan 1, 2008
2.958 trl
+210.196 bln
7.65%
jan 1, 2009
3.087 trl
+129.598 bln
4.38%
jan 1, 2010
2.898 trl
-188.991 bln
-6.12%
jan 1, 2011
3.054 trl
+155.653 bln
5.37%
jan 1, 2012
3.218 trl
+163.99 bln
5.37%
jan 1, 2013
3.31 trl
+91.987 bln
2.86%
jan 1, 2014
3.396 trl
+86.562 bln
2.62%
jan 1, 2015
3.45 trl
+53.158 bln
1.57%
jan 1, 2016
3.427 trl
-22.229 bln
-0.64%
Ranking of countries by current statistics by years


Comments: